

Category: News

Power Platform & Dynamics 365 Newsletter – April 2024
April 2024 Edition
The newsletter is attached below.
Welcome to the April 2024 Edition of the Power Platform and Dynamics 365 CE Newsletter!
April was packed with news and highlights!
As usual we have a lot of news and highlights to catch up on and plan!
2024 release Wave 1 GA staring April 2024. Use Release Planner
Best Practice for AI Adoption
Upcoming Microsoft events
Review the new deprecations and removal updates.
Review Power Apps, Dataverse, Copilot product updates.
TIPS: USE COPILOT TO SUMMARIZE THE DOC OR ASK QUESTIONS.
Thanks & regards.
Power Platform & D365 Newsletter Team
—
Advanced Support for Partners (ASfP) and Premier Support for Partners (PSfP) are paid partner offerings at Microsoft that provide unmatched value through a wide range of Partner benefits including account management, technical cloud enablement consultations, and an elevated technical support experience across the Microsoft Cloud (Azure, Microsoft 365, Dynamics 365, Power Platform).
Partners in ASfP have higher Microsoft AI Cloud Partner Program Capability Scores, attain more Solutions Partner designations, and see uplifts across Azure, M365, and D365. View the data and learn more on the new ASfP Impact slide below.
Please review these resources to learn more and consider booking a meeting to speak directly with our teams for a better understanding of the value-added benefits of ASfP and PSfP.
Book a meeting with an ASfP Evangelist
Book a meeting with a PSfP Specialist
Visit the ASfP Website
Visit the PSfP Website
Download the ASfP Fact Sheet
View the ASfP Impact Slide
Stop by the ASfP Partner Community
April 2024 Edition
The newsletter is attached below.
Welcome to the April 2024 Edition of the Power Platform and Dynamics 365 CE Newsletter!
April was packed with news and highlights!
As usual we have a lot of news and highlights to catch up on and plan!
2024 release Wave 1 GA staring April 2024. Use Release Planner
Best Practice for AI Adoption
Upcoming Microsoft events
Review the new deprecations and removal updates.
Review Power Apps, Dataverse, Copilot product updates.
TIPS: USE COPILOT TO SUMMARIZE THE DOC OR ASK QUESTIONS.
Thanks & regards.
Power Platform & D365 Newsletter Team
—
Advanced Support for Partners (ASfP) and Premier Support for Partners (PSfP) are paid partner offerings at Microsoft that provide unmatched value through a wide range of Partner benefits including account management, technical cloud enablement consultations, and an elevated technical support experience across the Microsoft Cloud (Azure, Microsoft 365, Dynamics 365, Power Platform).
Partners in ASfP have higher Microsoft AI Cloud Partner Program Capability Scores, attain more Solutions Partner designations, and see uplifts across Azure, M365, and D365. View the data and learn more on the new ASfP Impact slide below.
Please review these resources to learn more and consider booking a meeting to speak directly with our teams for a better understanding of the value-added benefits of ASfP and PSfP.
Book a meeting with an ASfP Evangelist
Book a meeting with a PSfP Specialist
Visit the ASfP Website
Visit the PSfP Website
Download the ASfP Fact Sheet
View the ASfP Impact Slide
Stop by the ASfP Partner Community Read More
Excel Sumifs help
I need to use a sumifs formula to add up a group of numbers with 3 different criterias, and it also needs to subtract my varying goal for the day.
I.e
Sumifs(‘mysummary’!F:F,’goals’!D:D,’goals’!F5,’goals’!E:E,’goals’!G5) but each of those numbers need to subtract my goal set for the day in theory a
Sumifs(‘mysummary’!F:F,’goals’!D:D-M5,’goals’!F5,’goals’!E:E,’goals’!G5)
I need to use a sumifs formula to add up a group of numbers with 3 different criterias, and it also needs to subtract my varying goal for the day. I.eSumifs(‘mysummary’!F:F,’goals’!D:D,’goals’!F5,’goals’!E:E,’goals’!G5) but each of those numbers need to subtract my goal set for the day in theory a Sumifs(‘mysummary’!F:F,’goals’!D:D-M5,’goals’!F5,’goals’!E:E,’goals’!G5) Read More
Formula needed to calculate average over current day in year
I’m looking for a formula to calculate a year-to-date daily average using Excel that would automatically change the amount of days as time goes on. Is there a function that can use a YTD sales quantity and divide by the current number of days from the beginning of the current year?
For example, say I have a total of 45,660 parts sold YTD as of April 22 2024. The average daily sales of that would be 45,660/112=407.7. Would I be able to use a function that would automatically change the 112 value to 113 as the calendar day advances?
I’m looking for a formula to calculate a year-to-date daily average using Excel that would automatically change the amount of days as time goes on. Is there a function that can use a YTD sales quantity and divide by the current number of days from the beginning of the current year? For example, say I have a total of 45,660 parts sold YTD as of April 22 2024. The average daily sales of that would be 45,660/112=407.7. Would I be able to use a function that would automatically change the 112 value to 113 as the calendar day advances? Read More
Business Applications Partner News: Week of April 22
Check out this week’s top resources to stay up-to-date on the latest Business Applications Partner News. Make sure to sign up for the new monthly Dynamics 365 and Power Platform partner newsletters launching soon.
What to register for:
THIS WEEK!
April 24 (Day 2): Q3 CSP Masters Copilot Sales & Technical Bootcamps
Starting April 24: April FY24 High Volume Acceleration Program (Advanced)
What to review/like/share:
Partner Alert: Announcing new features in Dynamics 365 Field Service and Supply Chain Management
Case studies:
Leapwork brings testing efficiencies to Dynamics 365 partners
Upzoids sparks transformation at All Pro Electrical using Power Pages
New FastTrack customer nomination instructions
Partner playbooks, newsletters, and guides
Power Platform Forrester survey
What to watch:
April 11 Tech Talk: Power Pages Site Copilot
New feature: Traceability in Dynamics 365 Supply Chain Management demo
Reminders: Register for the upcoming partner events!
Events:
May 2: Supply Chain Premium partner webinar
May 9: SMB Partner Hour
May 16-17: Directions Asia
May 21-23: Microsoft Build
May 30: Copilot Studio Partner Opportunity Webinar
Register for upcoming Microsoft AI Training Roadshows
Trainings:
Open April 1-May 31: Q4 Microsoft Catalyst Partner Training
April 30 (PDT), June 11 (IST) (BST): Dynamics 365 Supply Chain Management – Demand Planning Workshop
May 13-15 (PDT) | May 15-17 (IST) (BST): SMB Sales Bootcamp
Check out this week’s top resources to stay up-to-date on the latest Business Applications Partner News. Make sure to sign up for the new monthly Dynamics 365 and Power Platform partner newsletters launching soon.
What to register for:
THIS WEEK!
April 24 (Day 2): Q3 CSP Masters Copilot Sales & Technical Bootcamps
Starting April 24: April FY24 High Volume Acceleration Program (Advanced)
What to review/like/share:
Partner Alert: Announcing new features in Dynamics 365 Field Service and Supply Chain Management
Case studies:
Leapwork brings testing efficiencies to Dynamics 365 partners
Upzoids sparks transformation at All Pro Electrical using Power Pages
New FastTrack customer nomination instructions
Partner playbooks, newsletters, and guides
Power Platform Forrester survey
What to watch:
April 11 Tech Talk: Power Pages Site Copilot
New feature: Traceability in Dynamics 365 Supply Chain Management demo
Reminders: Register for the upcoming partner events!
Events:
May 2: Supply Chain Premium partner webinar
May 9: SMB Partner Hour
May 16-17: Directions Asia
May 21-23: Microsoft Build
May 30: Copilot Studio Partner Opportunity Webinar
Register for upcoming Microsoft AI Training Roadshows
Trainings:
Open April 1-May 31: Q4 Microsoft Catalyst Partner Training
April 30 (PDT), June 11 (IST) (BST): Dynamics 365 Supply Chain Management – Demand Planning Workshop
May 13-15 (PDT) | May 15-17 (IST) (BST): SMB Sales Bootcamp Read More
HELP with CTE or a Cursor to update multiple rows in 1 table ..selecting from Multiple databases
Server A Syetemtable of Dbname= ABC DbnameproductidABC123 Syetemtable of Dbname= XYZ DbnameproductidABC987 Syetemtable of Dbname= AQW DbnameproductidAQW123456 Like we have 1000 DB’s in Server A and each db has a system table 1 Main LOGIN info table in Server A Dabatase DB1 SELECT * from DB1. DBO.LOGIN table DBNameproduct IDABCNULLXYZA9065AQW33c@1442these rows in 1 main Login table are not matching the system table rows of each individual Databases Now I want to update 1 Main LOGIN info table in Server A Dabatase DB1, so that I get results matching each login table of all db’s SELECT * from DB1. DBO.LOGIN table DBNameproduct IDABC123XYZ987AQW123456
Server A Syetemtable of Dbname= ABC DbnameproductidABC123 Syetemtable of Dbname= XYZ DbnameproductidABC987 Syetemtable of Dbname= AQW DbnameproductidAQW123456 Like we have 1000 DB’s in Server A and each db has a system table 1 Main LOGIN info table in Server A Dabatase DB1 SELECT * from DB1. DBO.LOGIN table DBNameproduct IDABCNULLXYZA9065AQW33c@1442these rows in 1 main Login table are not matching the system table rows of each individual Databases Now I want to update 1 Main LOGIN info table in Server A Dabatase DB1, so that I get results matching each login table of all db’s SELECT * from DB1. DBO.LOGIN table DBNameproduct IDABC123XYZ987AQW123456 Read More
Unable to Reset Password
I’ve created an Outlook account recently but forgotten the credentials to log back in. Since after creating the account, my inbox has been empty but with only a welcome email. I’ve tried resetting the password via the automated form, which asks for basic details (First Name, Last Name, Microsoft Services used, Recent sent emails with exact Subject lines) but I keep receiving these crappy automated emails from the BOT saying “Unfortunately, our automated system has determined that the information you provided was not sufficient for us to validate your account ownership.“
I couldn’t find a customer service contact number (USA) or a support email to contact a HUMAN. Had anyone faced this issue before, if so how were you able resolve this?
Thanks in advance.
I’ve created an Outlook account recently but forgotten the credentials to log back in. Since after creating the account, my inbox has been empty but with only a welcome email. I’ve tried resetting the password via the automated form, which asks for basic details (First Name, Last Name, Microsoft Services used, Recent sent emails with exact Subject lines) but I keep receiving these crappy automated emails from the BOT saying “Unfortunately, our automated system has determined that the information you provided was not sufficient for us to validate your account ownership.” I couldn’t find a customer service contact number (USA) or a support email to contact a HUMAN. Had anyone faced this issue before, if so how were you able resolve this? Thanks in advance. Read More
Map Home-Directory attribute UNC path for locally connected azure-ad joined shared devices.
We have an on-premises Active Directory (AD) environment connected to Azure AD via AD Connect. We’ve successfully joined our devices to Azure AD using Azure AD Join (MEJ) through Autopilot. We also, using Passthrough Authentication (PTA) for Authentication and we have 3 PTA agents (Including AAD Connect) on-premises.
Now, we want to grant users access to an on-premises file share (File server) while they are physically connected to the local network at the office. Each user has an individual Home Drive (H:) defined in their On-premises “Home-Directory attribute” (HomeDirectory), and we want to make this H drive accessible for any users who sign-in to a locally connected shared AADJ devices at the office (We don’t want these H drives to be available for remote users). Our shared AADJ devices currently have access to on-premises share files when they’re locally connected at the office, but they don’t have access to user’s home drive now.
In summary, we want to map Home-Directory attribute UNC path for locally connected azure-ad joined shared devices for any individual users who sign in to these devices.
We have an on-premises Active Directory (AD) environment connected to Azure AD via AD Connect. We’ve successfully joined our devices to Azure AD using Azure AD Join (MEJ) through Autopilot. We also, using Passthrough Authentication (PTA) for Authentication and we have 3 PTA agents (Including AAD Connect) on-premises. Now, we want to grant users access to an on-premises file share (File server) while they are physically connected to the local network at the office. Each user has an individual Home Drive (H:) defined in their On-premises “Home-Directory attribute” (HomeDirectory), and we want to make this H drive accessible for any users who sign-in to a locally connected shared AADJ devices at the office (We don’t want these H drives to be available for remote users). Our shared AADJ devices currently have access to on-premises share files when they’re locally connected at the office, but they don’t have access to user’s home drive now. In summary, we want to map Home-Directory attribute UNC path for locally connected azure-ad joined shared devices for any individual users who sign in to these devices. Read More
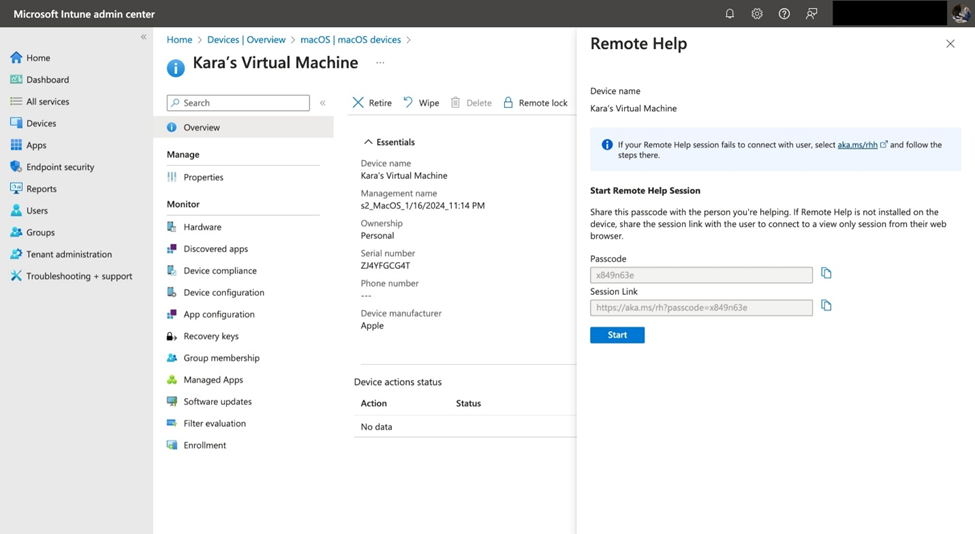
Microsoft Intune Remote Help adds full control for Mac
We’re excited to announce a major enhancement to Microsoft Intune Remote Help’s capabilities: full control support for macOS devices. With organizations that use macOS devices in their environments, providing efficient and secure remote assistance is paramount. This is part of a broader effort across Intune to provide cross-platform support and allow IT admins to manage any device with Intune. With this new functionality, IT help desks can now not only view Mac devices, but also take full control of them, streamlining troubleshooting and reducing time to mitigation. Whether it’s configuring settings, troubleshooting software glitches, or assisting information workers, help desks can tackle problems quickly and efficiently.
Remote Help empowers IT to provide secure helpdesk-to-user connections. Remote Help helps to mitigate security risks, improve efficiency, and support workers anywhere. With the rise of help desk spoofing, the strong authentication built into Remote Help and security controls are more important than ever. Every help desk connection can be trusted, protected with compliant, conditional access policies, including the ability to support multi-factor authentication—ensuring the identity of both the helper and end user. Before initiating a remote session, helpers receive non-compliance warnings if the user’s device does not adhere to organizational policies. Helpers and sharers can also maintain a continuous thread of communication throughout the session, leveraging the chat feature which supports special characters and multiple languages.
How Remote Help works with macOS devices
After an employee reports an IT issue, the help desk starts a Remote Help session through the Intune Admin Center so that they can assist.
The help desk technician can identify the relevant device and begin a Remote Help session within the Intune admin console.
When beginning a session, the helper now has the option of full control, which is a new capability for macOS devices.
The helper has the ability to begin a screensharing session or a full control session.
Remote Help shows the employee the help desk technician’s photo, name, job title, and domain verification through Entra ID creates confidence that the correct person is accessing their device.
The help desk’s photo, name, job title, and domain verification are all surfaced through Entra ID. The sharer is prompted to decline or allow the start of a Remote Help session.
Before beginning the session, Remote Help will check if the sharer’s device is compliant. When devices are not compliant, the helper will receive a warning, but can still proceed with the session.
Helper is warned that the sharer’s device is noncompliant per organizational standards.
Getting started with Remote Help
Microsoft Intune Remote Help is a key solution in the Microsoft Intune Suite. It is available as an add-on to any Microsoft 365 plan that includes Intune. To get started with Remote Help and the new support for macOS, start a trial of Microsoft Intune Suite today. For more information on Microsoft Intune Remote Help, visit our Microsoft Intune technical product documentation as well as the Microsoft Intune Remote Help product page.
Microsoft Tech Community – Latest Blogs –Read More
Accessing a vector form a matrix
Hi, I am writing a solver scipt where I will have outputed 3 vectors called x1, x2, and x3. I then plan to turn these into a 3 x (some value tbd) vector, meaning x=[x1, x2, x3].
In the main script I need to plot x1, x2 and x3 independently, which brings me to my question. How do I call, for instance, the x1 vector from the ‘x’ matrix so I can plot it please?Hi, I am writing a solver scipt where I will have outputed 3 vectors called x1, x2, and x3. I then plan to turn these into a 3 x (some value tbd) vector, meaning x=[x1, x2, x3].
In the main script I need to plot x1, x2 and x3 independently, which brings me to my question. How do I call, for instance, the x1 vector from the ‘x’ matrix so I can plot it please? Hi, I am writing a solver scipt where I will have outputed 3 vectors called x1, x2, and x3. I then plan to turn these into a 3 x (some value tbd) vector, meaning x=[x1, x2, x3].
In the main script I need to plot x1, x2 and x3 independently, which brings me to my question. How do I call, for instance, the x1 vector from the ‘x’ matrix so I can plot it please? matrix, vector, callback MATLAB Answers — New Questions
Error in AWGN Using Integers or scalar doubles
Need help correcting the following errors:
Error using +
Integers can only be combined with integers of the same class, or scalar doubles.
Error in awgn (line 157)
y = sig + noise;
Error in Computerassignmentfinal (line 20)
received_low = awgn(lenna_bits, SNR_low,’measured’);
The code attached.
clc;
clear all;
% Load the lenna image
lenna = imread(‘lenna.png’);
% Convert image to grayscale
lenna_gray = rgb2gray(lenna);
% Convert pixel values to bits
lenna_bits = reshape(de2bi(lenna_gray), [], 1);
% BPSK modulation
Eb_No_low = 0; % Low SNR
Eb_No_high = 4; % High SNR
SNR_low = 10^(Eb_No_low/10);
SNR_high = 10^(Eb_No_high/10);
% Transmit and receive at low SNR
received_low = awgn(lenna_bits, SNR_low,’measured’);
% Demodulation
decoded_low = received_low < 0;
% Reshape decoded bits to original image size
decoded_image_low = reshape(decoded_low, size(lenna_gray));
% Plot original and received image at low SNR
figure;
subplot(1,2,1); imshow(lenna_gray); title(‘Original Image’);
subplot(1,2,2); imshow(decoded_image_low); title(‘Received Image (0 dB SNR)’);
% Transmit and receive at high SNR
received_high = awgn(lenna_bits, SNR_high, ‘measured’);
% Demodulation
decoded_high = received_high < 0;
% Reshape decoded bits to original image size
decoded_image_high = reshape(decoded_high, size(lenna_gray));
% Plot original and received image at high SNR
figure;
subplot(1,2,1); imshow(lenna_gray); title(‘Original Image’);
subplot(1,2,2); imshow(decoded_image_high); title(‘Received Image (4 dB SNR)’);
% Linear error detection code
% Example: Hamming (7,4) code
parityMatrix = [1 1 1 0 1 0 0; 1 1 0 1 0 1 0; 1 0 1 1 0 0 1];
generatorMatrix = [eye(4) parityMatrix’];
% Encode the data
encoded_data = mod(lenna_bits * generatorMatrix, 2);
% Add noise
received_data = awgn(encoded_data, Eb_No_low, ‘measured’);
% Syndrome lookup table for error detection
syndrome_table = syndtable(parityMatrix);
% Decoding with error detection
decoded_data = zeros(size(encoded_data));
errors = zeros(size(encoded_data, 1), 1);
for i = 1:size(encoded_data, 1)
syndrome = mod(received_data(i, 🙂 * parityMatrix’, 2);
if sum(syndrome) ~= 0 % Error detected
errors(i) = 1;
else
decoded_data(i, 🙂 = received_data(i, :);
end
end
% Count number of retransmission requests at different SNRs
SNRs = [0, 2, 4, 6, 8, 10];
retransmissions = zeros(size(SNRs));
for i = 1:length(SNRs)
SNR = 10^(SNRs(i)/10);
received_data = awgn(encoded_data, SNR, ‘measured’);
errors = zeros(size(encoded_data, 1), 1);
for j = 1:size(encoded_data, 1)
syndrome = mod(received_data(j, 🙂 * parityMatrix’, 2);
if sum(syndrome) ~= 0 % Error detected
errors(j) = 1;
retransmissions(i) = retransmissions(i) + 1;
end
end
end
% Plot number of retransmissions against SNR values
figure;
plot(SNRs, retransmissions, ‘-o’);
xlabel(‘SNR (dB)’);
ylabel(‘Number of Retransmissions’);
title(‘Number of Retransmissions vs SNR’);
% Error correction code
% Example: Reed-Solomon code
n = 255;
k = 223;
t = 16;
rs_encoder = comm.RSEncoder(n, k);
rs_decoder = comm.RSDecoder(n, k);
% Encode data
encoded_rs = step(rs_encoder, double(lenna_bits));
% Add noise
received_rs_low = awgn(encoded_rs, Eb_No_low, ‘measured’);
received_rs_high = awgn(encoded_rs, Eb_No_high, ‘measured’);
% Decode received data
decoded_rs_low = step(rs_decoder, received_rs_low);
decoded_rs_high = step(rs_decoder, received_rs_high);
% Reshape decoded bits to original image size
decoded_image_rs_low = reshape(decoded_rs_low, size(lenna_gray));
decoded_image_rs_high = reshape(decoded_rs_high, size(lenna_gray));
% Plot original and received images with error correction
figure;
subplot(1,2,1); imshow(decoded_image_low); title(‘Received Image (0 dB SNR, No Error Correction)’);
subplot(1,2,2); imshow(decoded_image_rs_low); title(‘Received Image (0 dB SNR, Error Correction)’);
figure;
subplot(1,2,1); imshow(decoded_image_high); title(‘Received Image (4 dB SNR, No Error Correction)’);
subplot(1,2,2); imshow(decoded_image_rs_high); title(‘Received Image (4 dB SNR, Error Correction)’);Need help correcting the following errors:
Error using +
Integers can only be combined with integers of the same class, or scalar doubles.
Error in awgn (line 157)
y = sig + noise;
Error in Computerassignmentfinal (line 20)
received_low = awgn(lenna_bits, SNR_low,’measured’);
The code attached.
clc;
clear all;
% Load the lenna image
lenna = imread(‘lenna.png’);
% Convert image to grayscale
lenna_gray = rgb2gray(lenna);
% Convert pixel values to bits
lenna_bits = reshape(de2bi(lenna_gray), [], 1);
% BPSK modulation
Eb_No_low = 0; % Low SNR
Eb_No_high = 4; % High SNR
SNR_low = 10^(Eb_No_low/10);
SNR_high = 10^(Eb_No_high/10);
% Transmit and receive at low SNR
received_low = awgn(lenna_bits, SNR_low,’measured’);
% Demodulation
decoded_low = received_low < 0;
% Reshape decoded bits to original image size
decoded_image_low = reshape(decoded_low, size(lenna_gray));
% Plot original and received image at low SNR
figure;
subplot(1,2,1); imshow(lenna_gray); title(‘Original Image’);
subplot(1,2,2); imshow(decoded_image_low); title(‘Received Image (0 dB SNR)’);
% Transmit and receive at high SNR
received_high = awgn(lenna_bits, SNR_high, ‘measured’);
% Demodulation
decoded_high = received_high < 0;
% Reshape decoded bits to original image size
decoded_image_high = reshape(decoded_high, size(lenna_gray));
% Plot original and received image at high SNR
figure;
subplot(1,2,1); imshow(lenna_gray); title(‘Original Image’);
subplot(1,2,2); imshow(decoded_image_high); title(‘Received Image (4 dB SNR)’);
% Linear error detection code
% Example: Hamming (7,4) code
parityMatrix = [1 1 1 0 1 0 0; 1 1 0 1 0 1 0; 1 0 1 1 0 0 1];
generatorMatrix = [eye(4) parityMatrix’];
% Encode the data
encoded_data = mod(lenna_bits * generatorMatrix, 2);
% Add noise
received_data = awgn(encoded_data, Eb_No_low, ‘measured’);
% Syndrome lookup table for error detection
syndrome_table = syndtable(parityMatrix);
% Decoding with error detection
decoded_data = zeros(size(encoded_data));
errors = zeros(size(encoded_data, 1), 1);
for i = 1:size(encoded_data, 1)
syndrome = mod(received_data(i, 🙂 * parityMatrix’, 2);
if sum(syndrome) ~= 0 % Error detected
errors(i) = 1;
else
decoded_data(i, 🙂 = received_data(i, :);
end
end
% Count number of retransmission requests at different SNRs
SNRs = [0, 2, 4, 6, 8, 10];
retransmissions = zeros(size(SNRs));
for i = 1:length(SNRs)
SNR = 10^(SNRs(i)/10);
received_data = awgn(encoded_data, SNR, ‘measured’);
errors = zeros(size(encoded_data, 1), 1);
for j = 1:size(encoded_data, 1)
syndrome = mod(received_data(j, 🙂 * parityMatrix’, 2);
if sum(syndrome) ~= 0 % Error detected
errors(j) = 1;
retransmissions(i) = retransmissions(i) + 1;
end
end
end
% Plot number of retransmissions against SNR values
figure;
plot(SNRs, retransmissions, ‘-o’);
xlabel(‘SNR (dB)’);
ylabel(‘Number of Retransmissions’);
title(‘Number of Retransmissions vs SNR’);
% Error correction code
% Example: Reed-Solomon code
n = 255;
k = 223;
t = 16;
rs_encoder = comm.RSEncoder(n, k);
rs_decoder = comm.RSDecoder(n, k);
% Encode data
encoded_rs = step(rs_encoder, double(lenna_bits));
% Add noise
received_rs_low = awgn(encoded_rs, Eb_No_low, ‘measured’);
received_rs_high = awgn(encoded_rs, Eb_No_high, ‘measured’);
% Decode received data
decoded_rs_low = step(rs_decoder, received_rs_low);
decoded_rs_high = step(rs_decoder, received_rs_high);
% Reshape decoded bits to original image size
decoded_image_rs_low = reshape(decoded_rs_low, size(lenna_gray));
decoded_image_rs_high = reshape(decoded_rs_high, size(lenna_gray));
% Plot original and received images with error correction
figure;
subplot(1,2,1); imshow(decoded_image_low); title(‘Received Image (0 dB SNR, No Error Correction)’);
subplot(1,2,2); imshow(decoded_image_rs_low); title(‘Received Image (0 dB SNR, Error Correction)’);
figure;
subplot(1,2,1); imshow(decoded_image_high); title(‘Received Image (4 dB SNR, No Error Correction)’);
subplot(1,2,2); imshow(decoded_image_rs_high); title(‘Received Image (4 dB SNR, Error Correction)’); Need help correcting the following errors:
Error using +
Integers can only be combined with integers of the same class, or scalar doubles.
Error in awgn (line 157)
y = sig + noise;
Error in Computerassignmentfinal (line 20)
received_low = awgn(lenna_bits, SNR_low,’measured’);
The code attached.
clc;
clear all;
% Load the lenna image
lenna = imread(‘lenna.png’);
% Convert image to grayscale
lenna_gray = rgb2gray(lenna);
% Convert pixel values to bits
lenna_bits = reshape(de2bi(lenna_gray), [], 1);
% BPSK modulation
Eb_No_low = 0; % Low SNR
Eb_No_high = 4; % High SNR
SNR_low = 10^(Eb_No_low/10);
SNR_high = 10^(Eb_No_high/10);
% Transmit and receive at low SNR
received_low = awgn(lenna_bits, SNR_low,’measured’);
% Demodulation
decoded_low = received_low < 0;
% Reshape decoded bits to original image size
decoded_image_low = reshape(decoded_low, size(lenna_gray));
% Plot original and received image at low SNR
figure;
subplot(1,2,1); imshow(lenna_gray); title(‘Original Image’);
subplot(1,2,2); imshow(decoded_image_low); title(‘Received Image (0 dB SNR)’);
% Transmit and receive at high SNR
received_high = awgn(lenna_bits, SNR_high, ‘measured’);
% Demodulation
decoded_high = received_high < 0;
% Reshape decoded bits to original image size
decoded_image_high = reshape(decoded_high, size(lenna_gray));
% Plot original and received image at high SNR
figure;
subplot(1,2,1); imshow(lenna_gray); title(‘Original Image’);
subplot(1,2,2); imshow(decoded_image_high); title(‘Received Image (4 dB SNR)’);
% Linear error detection code
% Example: Hamming (7,4) code
parityMatrix = [1 1 1 0 1 0 0; 1 1 0 1 0 1 0; 1 0 1 1 0 0 1];
generatorMatrix = [eye(4) parityMatrix’];
% Encode the data
encoded_data = mod(lenna_bits * generatorMatrix, 2);
% Add noise
received_data = awgn(encoded_data, Eb_No_low, ‘measured’);
% Syndrome lookup table for error detection
syndrome_table = syndtable(parityMatrix);
% Decoding with error detection
decoded_data = zeros(size(encoded_data));
errors = zeros(size(encoded_data, 1), 1);
for i = 1:size(encoded_data, 1)
syndrome = mod(received_data(i, 🙂 * parityMatrix’, 2);
if sum(syndrome) ~= 0 % Error detected
errors(i) = 1;
else
decoded_data(i, 🙂 = received_data(i, :);
end
end
% Count number of retransmission requests at different SNRs
SNRs = [0, 2, 4, 6, 8, 10];
retransmissions = zeros(size(SNRs));
for i = 1:length(SNRs)
SNR = 10^(SNRs(i)/10);
received_data = awgn(encoded_data, SNR, ‘measured’);
errors = zeros(size(encoded_data, 1), 1);
for j = 1:size(encoded_data, 1)
syndrome = mod(received_data(j, 🙂 * parityMatrix’, 2);
if sum(syndrome) ~= 0 % Error detected
errors(j) = 1;
retransmissions(i) = retransmissions(i) + 1;
end
end
end
% Plot number of retransmissions against SNR values
figure;
plot(SNRs, retransmissions, ‘-o’);
xlabel(‘SNR (dB)’);
ylabel(‘Number of Retransmissions’);
title(‘Number of Retransmissions vs SNR’);
% Error correction code
% Example: Reed-Solomon code
n = 255;
k = 223;
t = 16;
rs_encoder = comm.RSEncoder(n, k);
rs_decoder = comm.RSDecoder(n, k);
% Encode data
encoded_rs = step(rs_encoder, double(lenna_bits));
% Add noise
received_rs_low = awgn(encoded_rs, Eb_No_low, ‘measured’);
received_rs_high = awgn(encoded_rs, Eb_No_high, ‘measured’);
% Decode received data
decoded_rs_low = step(rs_decoder, received_rs_low);
decoded_rs_high = step(rs_decoder, received_rs_high);
% Reshape decoded bits to original image size
decoded_image_rs_low = reshape(decoded_rs_low, size(lenna_gray));
decoded_image_rs_high = reshape(decoded_rs_high, size(lenna_gray));
% Plot original and received images with error correction
figure;
subplot(1,2,1); imshow(decoded_image_low); title(‘Received Image (0 dB SNR, No Error Correction)’);
subplot(1,2,2); imshow(decoded_image_rs_low); title(‘Received Image (0 dB SNR, Error Correction)’);
figure;
subplot(1,2,1); imshow(decoded_image_high); title(‘Received Image (4 dB SNR, No Error Correction)’);
subplot(1,2,2); imshow(decoded_image_rs_high); title(‘Received Image (4 dB SNR, Error Correction)’); error corrections MATLAB Answers — New Questions
When I use Turkish characters in comments, they turn into question marks when I reopen the file
When I use Turkish characters in comments in MATLAB, they turn into question marks when I reopen the file. How can I solve this issue?
I also encounter this problem when using a directory with turkish characters.
I’m using MATLAB 2023B, operating system is Windows 10.When I use Turkish characters in comments in MATLAB, they turn into question marks when I reopen the file. How can I solve this issue?
I also encounter this problem when using a directory with turkish characters.
I’m using MATLAB 2023B, operating system is Windows 10. When I use Turkish characters in comments in MATLAB, they turn into question marks when I reopen the file. How can I solve this issue?
I also encounter this problem when using a directory with turkish characters.
I’m using MATLAB 2023B, operating system is Windows 10. language, characters, encoding MATLAB Answers — New Questions
how to solve my problem that i write
I write this code and i wanne output that show me like a sinc function like picture that i attached. the other point is about my l value that i defined it, i wanne some random number between 11e-6 till 13e-6, is it true like this that i define?
tnx.
clc;
clear;
close all;
capital_lambda = 20e-6;
% define sellmier equation to obtain refractive index
lambda_sh=0.775e-6; % SH wavelength
nlithium_sh = 2.1784;
lambda_ff=1.55e-6; % FF wavelength
nlithium_ff = 2.1376;
% parameters
capital_lambda = 20e-6;
k_sh=(2*pi/lambda_sh)*nlithium_sh;
k_ff=(2*pi/lambda_ff)*nlithium_ff;
Delta_kk = k_sh-2*k_ff;
%km=2*pi/capital_lambda;
L = 1; % Length;
sigma_l = 2; % sigma_l = l*sigma_avg
N=L/(capital_lambda/2); % number of domains
l=unifrnd(11e-6,13e-6,[1,1000]); %
for i=l
f=exp(-(pi.^2) .* (sigma_l.^2)/2.*(l.^2));
Delta_k=(k_sh-2*k_ff)-pi./l;
E3= f .* (sinc((Delta_k .* L)/2)).^2 + ((1-f)/N);
end
plot(E3)
%plot(abs(fftshift(fft2(E3))))
xlabel(‘(Delta_k * L)/pi’);
ylabel(‘SHG Effiency’);I write this code and i wanne output that show me like a sinc function like picture that i attached. the other point is about my l value that i defined it, i wanne some random number between 11e-6 till 13e-6, is it true like this that i define?
tnx.
clc;
clear;
close all;
capital_lambda = 20e-6;
% define sellmier equation to obtain refractive index
lambda_sh=0.775e-6; % SH wavelength
nlithium_sh = 2.1784;
lambda_ff=1.55e-6; % FF wavelength
nlithium_ff = 2.1376;
% parameters
capital_lambda = 20e-6;
k_sh=(2*pi/lambda_sh)*nlithium_sh;
k_ff=(2*pi/lambda_ff)*nlithium_ff;
Delta_kk = k_sh-2*k_ff;
%km=2*pi/capital_lambda;
L = 1; % Length;
sigma_l = 2; % sigma_l = l*sigma_avg
N=L/(capital_lambda/2); % number of domains
l=unifrnd(11e-6,13e-6,[1,1000]); %
for i=l
f=exp(-(pi.^2) .* (sigma_l.^2)/2.*(l.^2));
Delta_k=(k_sh-2*k_ff)-pi./l;
E3= f .* (sinc((Delta_k .* L)/2)).^2 + ((1-f)/N);
end
plot(E3)
%plot(abs(fftshift(fft2(E3))))
xlabel(‘(Delta_k * L)/pi’);
ylabel(‘SHG Effiency’); I write this code and i wanne output that show me like a sinc function like picture that i attached. the other point is about my l value that i defined it, i wanne some random number between 11e-6 till 13e-6, is it true like this that i define?
tnx.
clc;
clear;
close all;
capital_lambda = 20e-6;
% define sellmier equation to obtain refractive index
lambda_sh=0.775e-6; % SH wavelength
nlithium_sh = 2.1784;
lambda_ff=1.55e-6; % FF wavelength
nlithium_ff = 2.1376;
% parameters
capital_lambda = 20e-6;
k_sh=(2*pi/lambda_sh)*nlithium_sh;
k_ff=(2*pi/lambda_ff)*nlithium_ff;
Delta_kk = k_sh-2*k_ff;
%km=2*pi/capital_lambda;
L = 1; % Length;
sigma_l = 2; % sigma_l = l*sigma_avg
N=L/(capital_lambda/2); % number of domains
l=unifrnd(11e-6,13e-6,[1,1000]); %
for i=l
f=exp(-(pi.^2) .* (sigma_l.^2)/2.*(l.^2));
Delta_k=(k_sh-2*k_ff)-pi./l;
E3= f .* (sinc((Delta_k .* L)/2)).^2 + ((1-f)/N);
end
plot(E3)
%plot(abs(fftshift(fft2(E3))))
xlabel(‘(Delta_k * L)/pi’);
ylabel(‘SHG Effiency’); sinc function, hann window, rectangle, fft, shg effiency MATLAB Answers — New Questions

Drop down list “moving” selection when selected in another cell
I am rather new to excel but have been able to figure out most things with a quick google search. However, this one thing is giving me trouble.
Here’s what I’m trying to achieve:
I have a spreadsheet with different zones I can assign my employees to.
Each zone has cells that are linked to a table with my employee’s names and I can select them via drop down menu.
When I want to move an employee to a different zone, I would like to be able to select their name in a different cell under the new zone and have it automatically reset the old cell containing their name to a blank cell.
Everything I see is just to make it so they can only be selected once, but this would eliminate them from the drop down menu as I assign them.
That means when I want to “move” them I’d have to reset their current cell to blank manually before being able to select them elsewhere.
I want the drop down list to include all of the names all the time but for it to reset the old cell to blank when I select them elsewhere.
Is this possible?
Please help!
I am rather new to excel but have been able to figure out most things with a quick google search. However, this one thing is giving me trouble. Here’s what I’m trying to achieve:I have a spreadsheet with different zones I can assign my employees to.Each zone has cells that are linked to a table with my employee’s names and I can select them via drop down menu.When I want to move an employee to a different zone, I would like to be able to select their name in a different cell under the new zone and have it automatically reset the old cell containing their name to a blank cell. Everything I see is just to make it so they can only be selected once, but this would eliminate them from the drop down menu as I assign them.That means when I want to “move” them I’d have to reset their current cell to blank manually before being able to select them elsewhere.I want the drop down list to include all of the names all the time but for it to reset the old cell to blank when I select them elsewhere. Is this possible? Please help! Read More
The Power of Manager Engagement: A Proven Strategy for Business Success
We know the manager’s role is important. They’re responsible for establishing strategies and goals, overseeing the work to achieve those goals, solving problems, as well as motivating, inspiring, and empowering employees to perform at their best. It’s a tall order. But what happens if a manager’s head isn’t in the game? Can employees be engaged and help the business succeed if their manager isn’t engaged in their own work? Are there business benefits from strong engagement among people managers? Simply put, does manager engagement matter separate from employee engagement?
As part of Microsoft Viva Glint, we get to work with some of the largest, most complex, and successful companies in the world, which includes leveraging the millions of employee feedback data points from our customers’ anonymized Glint survey data to try to answer these kinds of questions.
We got to work collecting and mapping the financial performance data from 862 publicly traded Glint customers over the course of a single year. We examined the survey scores only from those companies’ managers (from any level of management, from individual team managers up to the CEO level) and calculated a quartile rank for each survey item for each company. Those with item score averages above the 75th percentile were categorized as the “most engaged management” group and those below the 25th percentile categorized as the “least engaged management” group. We calculated the financial metrics for each group based on the year-end reporting of the companies’ financial results.
The answer: Yup, manager engagement definitely matters!
The results of the study were compelling. Organizations with more-engaged managers showed much better financial results, with a median pre-tax profit margin 3.25x higher than organizations with less-engaged managers. Additionally, these highly engaged manager organizations showed significantly better return on equity: 10x higher than organizations with less-engaged managers.
These findings highlight the importance of manager engagement in driving business success. By investing in the engagement of their managers, organizations can improve their business success. It is clear that managers’ attitudes influence employees’ attitude, and taking care of managers is also a way to take care of employees. A 2022 Glint research study about what matters most for driving employee engagement highlighted the importance of managers in driving employee engagement and satisfaction.
One key finding from the study was when managers felt positively about the company culture, their team members are also more likely to feel positively about it. Similarly, when managers recommend the company as a great place to work, their team members are also more likely to do so.
Take action
You want to drive business success, right? To do that, you’ll need to support the engagement and success of your managers. According to our research in partnership with Linked on how best to deliver that support, managers need more:
Access to training or learning resources (33% selected this among their responses)
Work-related coaching (32%)
Performance feedback (32%)
Emotional and mental health resources (30%)
Decision-making authority (24%)
Facilitating internal connections (24%)
The way forward
This recent research provides the evidence of what we suspected: the center of any business enterprise is its managers, and the enterprise’s success will depend on those managers’ success – both directly in the decisions they make, and indirectly in their influence on others in the organization. As organizations continue to change, adopt new and sometimes disruptive technologies, re-organize, re-size, and retrench, managers and manager engagement with their work will need to be supported and recognized. Winning organizations recognize this and make smart, targeted investments in their managers.
How do you support and engage your managers? Comment below!
__
Methodology
Financial performance data from 01/03/2022 to 12/30/2022 were collected and manually mapped to public Glint clients that had at least one survey with 10 or more manager respondents in 2022 (N=862 public companies).
Company item scores included scores only from manager respondents (any level of management from an individual team manager up to the CEO) and were aggregated by survey cycle, then by client, and were used to calculate a quartile rank for each company. Those companies with item score averages above the 75th percentile were bucketed into the “most engaged management” group and those with item score averages below the 25th percentile were bucketed into the “least engaged management” group. The financial metrics for each grouping were calculated based on the median 2022 year-end financial reporting of the companies in these two buckets.
Engagement was measured by two items: eSat – “How happy are you working at <Company Name>?” and Recommend – “I would recommend <company name> as a great place to work.”). These two items were the most “predictive” of the financial success measures: Stock Return (year end), Market Cap per Employee, Pretax Profit per Employee, Pretax Profit Margin, Return on Capital Employed, and Return on Equity. Other items were tested as well, and while they predicted some of the financial success measures well, the between them the Engagement items were effective in predicting all of them.
References
“Glint Manager Research”, June 2022
“How Combining Employee Engagement and Performance Management Fuels Organizational Success,” Harvard Business Review–Analytic Services
June 2022 LinkedIn Omnibus Survey
“LinkedIn Learning survey”, conducted for LinkedIn by Censuswide in July 2019, including >2,000 working professionals, ages 18-74, across the US.
“Manager Support Study”, June 2022 LinkedIn Omnibus Survey in partnership with LinkedIn Market Research, sample of 1963 employed English-speaking LinkedIn members.
Microsoft Tech Community – Latest Blogs –Read More

Sneak peek at new Azure edge infrastructure at Hannover Messe 2024
Written by Cosmos Darwin, Principal Group Manager on the Azure Edge & Platform team
This week is Hannover Messe 2024, the world’s biggest industrial trade fair. Microsoft is there, including members of the Azure Stack team, showcasing how the Microsoft Cloud enables end-to-end manufacturing solutions that help securely connect people, assets, and business processes, empowering organizations to be more resilient.
Near the center of our booth, you can watch a robotic assembly line put together battery parts. The line features standard OT assets from our partner Rockwell Automation and shows how an adaptive cloud approach together with open standards like OPC UA can accelerate industrial transformation. Azure IoT Operations enabled by Azure Arc flows data from the production line into Microsoft Fabric, enabling real-time monitoring and analysis in the cloud.
And if you look closer, you may spot an exciting new infrastructure solution hosting it all:
Caption: Glimpse the new Azure edge infrastructure at the Hannover Messe 2024 expo.
Hardware for the industrial edge
As organizations adopt new OT technologies like Azure IoT Operations, which runs on Kubernetes, a core challenge for IT is to provide an appropriate computing infrastructure at the edge to support it. They need an infrastructure solution that’s easy to deploy, easy to manage at-scale across many locations, and that provides all the capabilities needed to deliver the applications, like managed Kubernetes and enterprise-grade resiliency. Most important of all, it needs to work in an edge setting like a factory floor, where neither the environmental factors nor the budget can accommodate a rack of servers.
For these kinds of situations, our team is working to extend Azure edge infrastructure to smaller form factor devices: edge/industrial PCs. The demo at Hannover Messe runs on three Lenovo ThinkEdge SE30s, an exemplar of this new category. These devices are great: they’re rugged, affordable, and they provide just the right amount of capability for this application, with an Intel Core™ i5 vPro® processor and 16 GiB of memory each.
Caption: Lenovo ThinkEdge SE30 is a great example of the edge/industrial PC device category.
Optimized low-footprint architecture
To make the most of limited resources, this new infrastructure solution blends familiar elements of Azure Stack HCI with some exciting new approaches. Azure Linux is used as the host operating system, and then the Azure Kubernetes Service is used to turn those machines into a Kubernetes cluster. The result is Kubernetes running directly on bare metal, with no virtualization at all. The whole infrastructure solution is deployed and operated from Azure cloud.
Caption: Solution architecture uses Azure Linux and AKS on baremetal to minimize footprint.
(Equivalently, for a more familiar experience, you could also run Windows IoT Enterprise as the host operating system with AKS Edge Essentials virtualized on top. We’re all one engineering team here in Azure, so we won’t be offended – pick whichever OS you prefer!)
Managed from the cloud – demo!
Beyond the on-device architecture, the core promise of adaptive cloud is a unified control plane to manage the whole solution, from apps to infrastructure. Check out this short demo to see how the Azure resource manager (ARM) and Azure Portal can be used with this new edge infrastructure: the solution is presented by a native ARM resource; its configuration is pushed from the cloud to enable repeatability and infrastructure-as-code; integration with management services like Azure Monitor is seamless; and you can even drill down into Kubernetes resources with just a few clicks.
Get ready to try it yourself
For now, this new edge infrastructure solution is a technology demonstration, but we’ve been pleasantly surprised how well it works. We plan to start previews later this year. If you’re interested, sign up now to be among the first to get early access. And in the meantime, watch this space for more news about all things edge infrastructure, from hyperconverged servers to edge/industrial PCs.
<3
– Cosmos
Microsoft Tech Community – Latest Blogs –Read More
Microsoft Dynamics 365 Finance Functional Consultant Blueprint Survey Opportunity
Greetings!
Microsoft is updating a certification for Microsoft Dynamics 365 Finance Functional Consultant, and we need your input through our exam blueprinting survey.
The blueprint determines how many questions each skill in the exam will be assigned. Please complete the online survey by May 7th, 2024. Please also feel free to forward the survey to any colleagues you consider subject matter experts for this certification. If you have any questions, feel free to contact Rohan Mahadevan rmahadevan@microsoft.com or John Sowles at josowles@microsoft.com.
Microsoft Dynamics 365 Finance Functional Consultant blueprint survey link:
https://microsoftlearning.co1.qualtrics.com/jfe/form/SV_3DiP1FrsVMj9y2W
Read More

Join the Viva Customer Showcase: Wallenius Wilhelmsen
Join us for the Viva Customer Showcase: Wallenius Wilhelmsen with Mitty Leong, the End User Experience Manager at Wallenius Wilhelmsen, as she unveils how WW uses Viva to drive their Copilot adoption. WW has seen early success in onboarding Copilot users, driving consistent and targeted messages, and has visibility into their Copilot adoption process by using the Copilot Dashboard. Don’t miss this opportunity to gain insights into their early triumphs and learn how you can replicate their success.
Join us for the Viva Customer Showcase: Wallenius Wilhelmsen with Mitty Leong, the End User Experience Manager at Wallenius Wilhelmsen, as she unveils how WW uses Viva to drive their Copilot adoption. WW has seen early success in onboarding Copilot users, driving consistent and targeted messages, and has visibility into their Copilot adoption process by using the Copilot Dashboard. Don’t miss this opportunity to gain insights into their early triumphs and learn how you can replicate their success. Read More
Custom Roles – Operating System Recovery Configurations, what is this?
Hi,
I’m working on creating a custom role for local device administrators. To this end I’m going through each permission and deciding on a case-by-case basis what to grant. I’ve come across this permission category in a few built-in roles, with the permissions listed as Assign Profiles, Create Profiles etc. The information box simply says these are for use on Operating System Recovery Profiles, but I cant find any information on what those are or what granting those permissions will allow. Can someone point me to a doc or a link to an explanation of what an Operating System Recovery Configuration or Profile is?
Thanks.
Hi,I’m working on creating a custom role for local device administrators. To this end I’m going through each permission and deciding on a case-by-case basis what to grant. I’ve come across this permission category in a few built-in roles, with the permissions listed as Assign Profiles, Create Profiles etc. The information box simply says these are for use on Operating System Recovery Profiles, but I cant find any information on what those are or what granting those permissions will allow. Can someone point me to a doc or a link to an explanation of what an Operating System Recovery Configuration or Profile is? Thanks. Read More
How can I make non-recurring meetings in Bookings?
I want to utilize Bookings to set up a way for people to schedule training sessions. They occur randomly and are non-recurring..
I want to utilize Bookings to set up a way for people to schedule training sessions. They occur randomly and are non-recurring.. Read More


