

Category: News
Tip for beginners: Remove first & last characters from text
You might be familiar with the LEFT & RIGHT functions, which always take a fixed number of characters from the left or right side of a piece of text.
However, if you want to remove a fixed number of characters this doesn’t work, so we have to make it more dynamic with the LEN function.
The LEN function gives you the number of characters a piece of text has.
So when we put it all together you can use this function, to remove the first 3 characters from a piece of text:
=RIGHT(A1, LEN(A1) – 3)
I also made a video with some more examples: https://www.youtube.com/watch?v=J3TNjJEvkMY
Do you know any other ways to get the same result? Perhaps easier or more robust?
You might be familiar with the LEFT & RIGHT functions, which always take a fixed number of characters from the left or right side of a piece of text. However, if you want to remove a fixed number of characters this doesn’t work, so we have to make it more dynamic with the LEN function. The LEN function gives you the number of characters a piece of text has. So when we put it all together you can use this function, to remove the first 3 characters from a piece of text:=RIGHT(A1, LEN(A1) – 3) I also made a video with some more examples: https://www.youtube.com/watch?v=J3TNjJEvkMY Do you know any other ways to get the same result? Perhaps easier or more robust? Read More

2 time interval data into another
Hi guys,
so the picture below shows the data I’m analysing just my issue is the Nour level 5-10 data on the right is timers from 15 minute increments where as the ones on the left are 5 minute increments and having difficulty or well very time consuming to separate it out so when I graph it I can line it up against one another to trend.
Ive tried text to column and filtering but I don’t get the results I want unfortunately so don’t know what else to try outside of the time consuming of shift down cells
Hi guys, so the picture below shows the data I’m analysing just my issue is the Nour level 5-10 data on the right is timers from 15 minute increments where as the ones on the left are 5 minute increments and having difficulty or well very time consuming to separate it out so when I graph it I can line it up against one another to trend.Ive tried text to column and filtering but I don’t get the results I want unfortunately so don’t know what else to try outside of the time consuming of shift down cells Read More
Get-aduser is not working in PS7 if i am trying to filter user using attribute Whencreated.
below code is working in PS 5.1 but Not in PS 7.4.2
$when = $(Get-Date).AddDays(-3).date
$data = Get-ADUser -Filter {whenCreated -ge $When}
$data.count
Error: Get-ADObject: Error parsing query: ‘whenChanged -gt 05/06/2024 00:00:00’ Error Message: ‘Operator Not supported: ‘ at position: ’19’.
below code is working in PS 5.1 but Not in PS 7.4.2 $when = $(Get-Date).AddDays(-3).date$data = Get-ADUser -Filter {whenCreated -ge $When}$data.count Error: Get-ADObject: Error parsing query: ‘whenChanged -gt 05/06/2024 00:00:00’ Error Message: ‘Operator Not supported: ‘ at position: ’19’. Read More
Subsite Document Library Unique Permissions Not Working
Hello there, I am the site owner for the main site as well as the subsite. Here’s a rundown of what’s going on.
In the main site, we’ll call it X, the permission level is set to read for an AD group users_all, (basically everyone in the org), then full control as myself the site owner. In the subsite, we’ll call it Y, the same read level access is set for the site, users_all. I confirmed both X and Y have the exact same permission settings, with full control being delegated to myself the site owner. In subsite Y, I have two document libraries I’m trying to restrict access to. I revoked inherit permissions from parent site for both libraries, and removed all access except for myself having full control as the site owner. I then added one AD group to have read access for each one, each group only contains roughly 3-4 people
The problem is even after all of this, everyone in the org can still view the doc libraries, download the files, etc. I tried repeating the entire process by resetting the perms for the doc libraries, revoke inherit from parent site, remove all other perms except myself as site owner, then adding the two AD groups again. I waited multiple sync cycles, waited 24 hours, same issue is still occurring. I read something online about anonymous access being enabled for the parent site, but couldn’t find any setting related to this
Hope someone can help
Hello there, I am the site owner for the main site as well as the subsite. Here’s a rundown of what’s going on. In the main site, we’ll call it X, the permission level is set to read for an AD group users_all, (basically everyone in the org), then full control as myself the site owner. In the subsite, we’ll call it Y, the same read level access is set for the site, users_all. I confirmed both X and Y have the exact same permission settings, with full control being delegated to myself the site owner. In subsite Y, I have two document libraries I’m trying to restrict access to. I revoked inherit permissions from parent site for both libraries, and removed all access except for myself having full control as the site owner. I then added one AD group to have read access for each one, each group only contains roughly 3-4 people The problem is even after all of this, everyone in the org can still view the doc libraries, download the files, etc. I tried repeating the entire process by resetting the perms for the doc libraries, revoke inherit from parent site, remove all other perms except myself as site owner, then adding the two AD groups again. I waited multiple sync cycles, waited 24 hours, same issue is still occurring. I read something online about anonymous access being enabled for the parent site, but couldn’t find any setting related to this Hope someone can help Read More
Only including cells containing certain words / numbers in formula?
I have a new job as a sepsis specialist nurse. At the end of the month, using all the data inputted throughout the month, I have to work out how many high risk patients received IV antibiotics within 1 hours. I would greatly appreciate your help, as I have never worked with Excel before
So the calculation I’m after would be as follows:
Only include only patients categorized as HIGH (column I) which contains either High or Low. Of these I need to take any patient with 01:00 (1 hour) or less (Column Q). Then divide by the total amount of High risk patients to give me a percentage of patients that received IV antibiotics within 1 hour. Hope that makes sense
Thanks for your help
I have a new job as a sepsis specialist nurse. At the end of the month, using all the data inputted throughout the month, I have to work out how many high risk patients received IV antibiotics within 1 hours. I would greatly appreciate your help, as I have never worked with Excel before So the calculation I’m after would be as follows: Only include only patients categorized as HIGH (column I) which contains either High or Low. Of these I need to take any patient with 01:00 (1 hour) or less (Column Q). Then divide by the total amount of High risk patients to give me a percentage of patients that received IV antibiotics within 1 hour. Hope that makes sense Thanks for your help Read More

Invitation to join our Avanade Nonprofit Leaders Copilot Community!
Our team at Avanade has been working relentlessly alongside Microsoft to prioritize bringing the benefits of Generative AI to the Third Sector with priority.
Three weeks ago during our annual Nonprofit Innovation Summit in Barcelona we had the privilege to spend time on the subject with many NGO leaders in a two-day expert session; we set out to navigate the complexities of responsible AI adoption based on our early work with forward thinking NGO’s.
Being on this journey and learning together is an embodiment of our organization’s mission: To do what matters and advance the world through the power of people and Microsoft.
If you would like to join our vibrant community drop me a note!
Avanade Nonprofit Innovation Summit
Our team at Avanade has been working relentlessly alongside Microsoft to prioritize bringing the benefits of Generative AI to the Third Sector with priority.Three weeks ago during our annual Nonprofit Innovation Summit in Barcelona we had the privilege to spend time on the subject with many NGO leaders in a two-day expert session; we set out to navigate the complexities of responsible AI adoption based on our early work with forward thinking NGO’s. Being on this journey and learning together is an embodiment of our organization’s mission: To do what matters and advance the world through the power of people and Microsoft. If you would like to join our vibrant community drop me a note! Avanade Nonprofit Innovation Summit Read More
Name manager, refers to – character limit
Hello everyone
What is the character limit for the ‘Refers to’ field in the Name Manager?
I am trying to write a recursive lambda function, but I am unable to paste the function into the field listed above.
On the other hand, I have been able to create a Lambda function in the Advanced formula environment (Excel Labs add-in), but it returns an error in the worksheet.
The length of the formula is around 2600 to 3300 characters depending on the version.
I am using Office 365 32bit
Hello everyoneWhat is the character limit for the ‘Refers to’ field in the Name Manager?I am trying to write a recursive lambda function, but I am unable to paste the function into the field listed above.On the other hand, I have been able to create a Lambda function in the Advanced formula environment (Excel Labs add-in), but it returns an error in the worksheet.The length of the formula is around 2600 to 3300 characters depending on the version.I am using Office 365 32bit Read More

Partial Bold Logic of a Cell in VBA
In above picture, the first character of the cell is bold, and the second is not. However, in aa, when I select the cell, the cell is not shown as bold; in bb, the cell is shown as bold.
How to reproduce aa in VBA? When I use Characters(,).Font, it always give me results like bb.
Thanks in advance.
In above picture, the first character of the cell is bold, and the second is not. However, in aa, when I select the cell, the cell is not shown as bold; in bb, the cell is shown as bold. How to reproduce aa in VBA? When I use Characters(,).Font, it always give me results like bb. Thanks in advance. Read More

Parablu, Skypoint, and Tiger Technology offer transactable partner solutions in Azure Marketplace
Microsoft partners like Parablu, Skypoint, and Tiger Technology deliver transact-capable offers, which allow you to purchase directly from Azure Marketplace. Learn about these offers below:
BluVault for Microsoft 365: Parablu’s backup solution for Microsoft 365 offers effortless integration with Active Directory, Azure Active Directory, and Okta for seamless single sign-on (SSO) functionality. Built on the tenets of the Zero Trust model, BluVault provides protection by encrypting data during transit and at rest. Additionally, BluVault’s data repository in the cloud creates a virtual air gap to insulate your valuable data from ransomware.
Skypoint AI Platform for Value-Based Care: Skypoint’s AI platform unifies your data sources into a data lakehouse, including structured data (financial, clinical, electronic health record), unstructured data (documents, video, audio), and your internal knowledge graph. Then, using a trained large language model for context, users can chat with your unified data set using conversational language via Skypoint’s private ChatGPT-4 plug-in.
Tiger Bridge: Tiger Technology’s data management solution for hybrid workflows connects your data stored locally with your cloud storage while preserving its native format to ensure transparent access. Tiger Bridge intelligently assigns data to Azure hot, cool, cold, and archive tiers, and workflows are fully compliant with Active Directory. Tiger Bridge can run on physical or virtual instances or can be run on a separate gateway.
Microsoft Tech Community – Latest Blogs –Read More
How to code a pulse function in differential equations
Hello everyone,
could you help me with my problem described below?
assuming I have a simple model dX/dt = -k*X/V, where X is amount, t is time (between 0 and 24 hours), V is volume, and k is rate.
I would like to add a certain amount of mass (M) into my system every 1 hour, in other words, adding mass on 1, 2, 3…23 hour. It does not need to be exactly on every hour, but could be a small interval (tau) around 1, 2, 3, … so equation becomes something like
dX/dt = -k*X/V + M/tau, M is zero when t is out of these small intervals.
I just cannot figure out a smart way to code this, and then solve the ODE. Could you give me some idea? Thanks in advance!
RuiHello everyone,
could you help me with my problem described below?
assuming I have a simple model dX/dt = -k*X/V, where X is amount, t is time (between 0 and 24 hours), V is volume, and k is rate.
I would like to add a certain amount of mass (M) into my system every 1 hour, in other words, adding mass on 1, 2, 3…23 hour. It does not need to be exactly on every hour, but could be a small interval (tau) around 1, 2, 3, … so equation becomes something like
dX/dt = -k*X/V + M/tau, M is zero when t is out of these small intervals.
I just cannot figure out a smart way to code this, and then solve the ODE. Could you give me some idea? Thanks in advance!
Rui Hello everyone,
could you help me with my problem described below?
assuming I have a simple model dX/dt = -k*X/V, where X is amount, t is time (between 0 and 24 hours), V is volume, and k is rate.
I would like to add a certain amount of mass (M) into my system every 1 hour, in other words, adding mass on 1, 2, 3…23 hour. It does not need to be exactly on every hour, but could be a small interval (tau) around 1, 2, 3, … so equation becomes something like
dX/dt = -k*X/V + M/tau, M is zero when t is out of these small intervals.
I just cannot figure out a smart way to code this, and then solve the ODE. Could you give me some idea? Thanks in advance!
Rui pulse function, differential equation MATLAB Answers — New Questions
Can anyone help me with these practice questions? trying to get the hang of MATLAB solo. Thanks
Polynomial interpolation using MATLAB
img = imread(‘Screenshot 2024-05-09 083558.png’);
imshow(img)Polynomial interpolation using MATLAB
img = imread(‘Screenshot 2024-05-09 083558.png’);
imshow(img) Polynomial interpolation using MATLAB
img = imread(‘Screenshot 2024-05-09 083558.png’);
imshow(img) matlab, matrix, interpolation MATLAB Answers — New Questions
model predictive control toolbox
What is the difference between mpcobj and sim commands in model predictive control toolbox. mpcobj command runs open loop system or closed loop systemWhat is the difference between mpcobj and sim commands in model predictive control toolbox. mpcobj command runs open loop system or closed loop system What is the difference between mpcobj and sim commands in model predictive control toolbox. mpcobj command runs open loop system or closed loop system model predictive control toolbox MATLAB Answers — New Questions
Please tell me save as text file !!!!!!!!!!!!!!!!!!!!
I want to change my result to text file
I use ascii file(change at origin), fi and fitmelting curves.m
After calculating using the ascii file(change at origin) and fitmelting curves.m, I got the resultant red graph. The black graph is the data I tried to calculate and the result is the red graph.
But the red graph is only saved as an image such as png, bmp. I want to change the red graph to a text file!!!!
Can you tell me how to do it ? ;(I want to change my result to text file
I use ascii file(change at origin), fi and fitmelting curves.m
After calculating using the ascii file(change at origin) and fitmelting curves.m, I got the resultant red graph. The black graph is the data I tried to calculate and the result is the red graph.
But the red graph is only saved as an image such as png, bmp. I want to change the red graph to a text file!!!!
Can you tell me how to do it ? ;( I want to change my result to text file
I use ascii file(change at origin), fi and fitmelting curves.m
After calculating using the ascii file(change at origin) and fitmelting curves.m, I got the resultant red graph. The black graph is the data I tried to calculate and the result is the red graph.
But the red graph is only saved as an image such as png, bmp. I want to change the red graph to a text file!!!!
Can you tell me how to do it ? ;( save method, text MATLAB Answers — New Questions
SQL Server Network Bandwidth Limit
Hello, I Have a Problem where i have Gigabit Internet for the main SQL Server, and also on the client side i have gigabit Internet as well, but when i monitor network activity for the client application ( written in c#) , the data transfer only max out at 20Mb/Sec. Down,
and this is not the same for any other projects on the same sql server, so what could be wrong here,
database config, server config, visual studio project properties, since i can’t seem to find a concrete answer on why it is not reaching the actual connection speed
please note that both hardware support over 3GB Read & Write Speeds so it is not a hardware bottleneck
Hello, I Have a Problem where i have Gigabit Internet for the main SQL Server, and also on the client side i have gigabit Internet as well, but when i monitor network activity for the client application ( written in c#) , the data transfer only max out at 20Mb/Sec. Down, and this is not the same for any other projects on the same sql server, so what could be wrong here, database config, server config, visual studio project properties, since i can’t seem to find a concrete answer on why it is not reaching the actual connection speedplease note that both hardware support over 3GB Read & Write Speeds so it is not a hardware bottleneck Read More
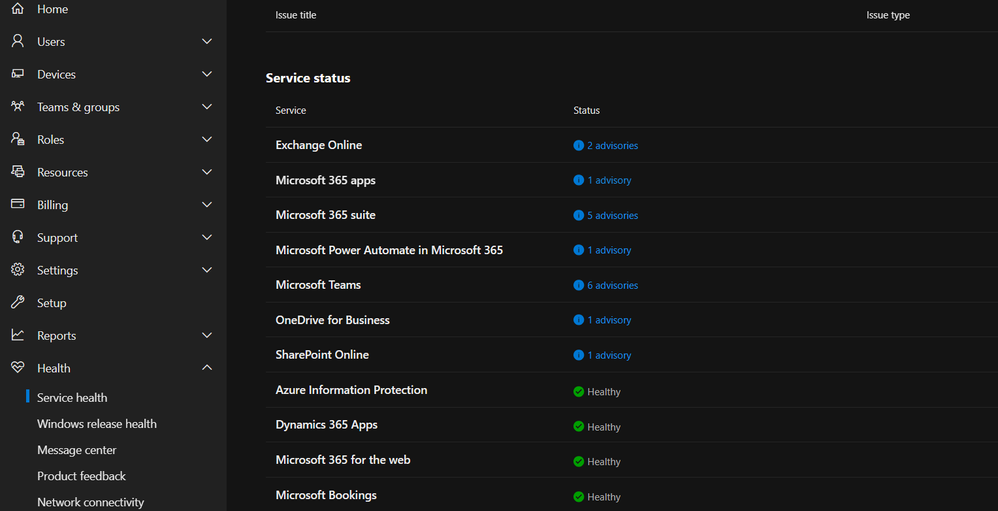
Office 365 health dashboard advisories
How to fix these advisories users are facing issues in teams and exchange services.
Teams required sign-in again and again and Microsoft Exchange required need password.
please guide me.
How to fix these advisories users are facing issues in teams and exchange services.Teams required sign-in again and again and Microsoft Exchange required need password. please guide me. Read More
How to start affiliate marketing?
Pick your niche. Affiliate marketers can reach specific audiences composed of potential customers, making them valuable to merchants. … Pick a platform that matches your niche. … Join an affiliate marketing network. … Expand your network. … Be consistent and master your skills.
Pick your niche. Affiliate marketers can reach specific audiences composed of potential customers, making them valuable to merchants. … Pick a platform that matches your niche. … Join an affiliate marketing network. … Expand your network. … Be consistent and master your skills. Read More
Wildcard characters not working in COUNTIFS function
Hi y’all,
this was a real brain scratcher for me, I gave up and went to the internet looking for answers. Here’s my situation:
I have two columns. Column 1 has names in it, Column 2 has dates (in this very format, no spaces between the characters).
NameDateJohn Doe
30.04.2024
Jane Doe25.03.2024
Now when I want to get the number of how many times has John Doe appeared in April I was using the formula:
=COUNTIFS(A21:E500;”John Doe”;B21:A500;”*.04.2024″)
But this formula returns big fat 0.
When I tried to fiddle with it to see if I have my other stuff right, I used the full date without the asterisk:
=COUNTIFS(A21:E500;”John Doe”;B21:A500;”30.04.2024″)
And this returned “1” as it should have.
My question is – am I using the wildcard characters wrong? I even tried “??.04.2024” string but to no avail. These wildcard characters worked for me successfully in other formulas, I don’t know why COUNTIFS has a problem with them.
I am using Microsoft Office Professional Plus 2019 package.
Hi y’all,this was a real brain scratcher for me, I gave up and went to the internet looking for answers. Here’s my situation:I have two columns. Column 1 has names in it, Column 2 has dates (in this very format, no spaces between the characters).NameDateJohn Doe30.04.2024Jane Doe25.03.2024 Now when I want to get the number of how many times has John Doe appeared in April I was using the formula: =COUNTIFS(A21:E500;”John Doe”;B21:A500;”*.04.2024″) But this formula returns big fat 0.When I tried to fiddle with it to see if I have my other stuff right, I used the full date without the asterisk:=COUNTIFS(A21:E500;”John Doe”;B21:A500;”30.04.2024″) And this returned “1” as it should have. My question is – am I using the wildcard characters wrong? I even tried “??.04.2024” string but to no avail. These wildcard characters worked for me successfully in other formulas, I don’t know why COUNTIFS has a problem with them.I am using Microsoft Office Professional Plus 2019 package. Read More
Multiple datawarehouse in one workspace under synapse/Datafactory
Hello,
is it possible to create multiple datawarehouses in one workspace under Synapse or Data Factory?
If it does, are we able to create link which allows me to join tables from datawarehouse together as a query?
Many thanks
Hello, is it possible to create multiple datawarehouses in one workspace under Synapse or Data Factory?If it does, are we able to create link which allows me to join tables from datawarehouse together as a query? Many thanks Read More
Town meeting problems in Team educational
Hello,
If I serach to start a new “Town Meeting” reunion in my updated team (in an unpdated W11) I fail to save the meeting.
The error message is cryptic: “Something went wrong, and we need to try again.”
Thanks,
Fabiano
Hello,If I serach to start a new “Town Meeting” reunion in my updated team (in an unpdated W11) I fail to save the meeting.The error message is cryptic: “Something went wrong, and we need to try again.” Thanks,Fabiano Read More
8 Ways To Stay Physically and Mentally Healthy **AllDaySlimmingTea**
Get Up and Move. Physical activity does more than improve your physical health. …
Snack Wisely. …Plan “You” Time into Your Day. …Boost Your Immunity With Food. …Take a Deep Breath. …Practice Good Posture While Working. …Prepare for a Good Night’s Sleep. …Remember That You’re Not Alone.
Get Up and Move. Physical activity does more than improve your physical health. …Snack Wisely. …Plan “You” Time into Your Day. …Boost Your Immunity With Food. …Take a Deep Breath. …Practice Good Posture While Working. …Prepare for a Good Night’s Sleep. …Remember That You’re Not Alone. Read More


