

Category: News
; when trying to count how many zeros and ones are randomly generated.")
Error using countOnes = sum(num); when trying to count how many zeros and ones are randomly generated.
I have never used MATLAB before, and am trying to randomly generate 0s and 1s to calculate the probability of getting heads or tails on a coin. I used the code below, but keep getting an error on the line showing countOnes = sum(num); saying ‘array indices must be positive integers or logical values.’. Anyone know what might be wrong? I clicked the explain error and it wasn’t clear.
rng(‘shuffle’); %Generates a random number each time, instead of the same sequence
N = 1000; %Sets value of N to 1000 to simulate 1000 flips of the coin
num = randi([0,1], N, 1); %Generates a number 0 or 1
countOnes = sum(num);
countZeros = N – countOnes;
disp([‘Number of 1s: ‘, num2str(countOnes)]);
disp([‘Number of 0s: ‘, num2str(countZeros)]);I have never used MATLAB before, and am trying to randomly generate 0s and 1s to calculate the probability of getting heads or tails on a coin. I used the code below, but keep getting an error on the line showing countOnes = sum(num); saying ‘array indices must be positive integers or logical values.’. Anyone know what might be wrong? I clicked the explain error and it wasn’t clear.
rng(‘shuffle’); %Generates a random number each time, instead of the same sequence
N = 1000; %Sets value of N to 1000 to simulate 1000 flips of the coin
num = randi([0,1], N, 1); %Generates a number 0 or 1
countOnes = sum(num);
countZeros = N – countOnes;
disp([‘Number of 1s: ‘, num2str(countOnes)]);
disp([‘Number of 0s: ‘, num2str(countZeros)]); I have never used MATLAB before, and am trying to randomly generate 0s and 1s to calculate the probability of getting heads or tails on a coin. I used the code below, but keep getting an error on the line showing countOnes = sum(num); saying ‘array indices must be positive integers or logical values.’. Anyone know what might be wrong? I clicked the explain error and it wasn’t clear.
rng(‘shuffle’); %Generates a random number each time, instead of the same sequence
N = 1000; %Sets value of N to 1000 to simulate 1000 flips of the coin
num = randi([0,1], N, 1); %Generates a number 0 or 1
countOnes = sum(num);
countZeros = N – countOnes;
disp([‘Number of 1s: ‘, num2str(countOnes)]);
disp([‘Number of 0s: ‘, num2str(countZeros)]); random number generator, probability MATLAB Answers — New Questions
ode23 clarity and examples
clc; clearvars; close all; format short g; format compact;
global Qss Q Qjss Qj V Vj Tinss Tin Tjinss Tjin cp cpj rho rhoj UA
% Q in m^3/s, V in m^3, T in oC, cp in J/kg K, rho in kg/m^3
% Physical properties
rho = 1000; rhoj = 1000; cp = 1269; cpj = 1269; UA = 1796; % J/K s
% Geometric parameters
V = 0.2832; Vj = 0.02832;
% Steady state process parameters
Qss = 4.719e-4; Qjss = 7.078e-4; Tinss = 10; Tjinss = 93.33;
% Actual process parameters
Q = 4.719e-4; Qj = 7.078e-4; Tin = 10; Tjin = 93.33;
% Tss = 51.67; Tjss = 65.56; % in oC (steady-state values from book)
% Linear stability analysis
A11 = -(Qss/V)-(UA/(rho*V*cp));
A12 = (UA/(rho*V*cp));
A21 = (UA/(rhoj*Vj*cpj));
A22 = -(Qjss/Vj)-(UA/(rhoj*Vj*cpj));
A = [A11 A12; A21 A22];
[ev, eval] = eig(A);
exitTs = fsolve(@tankheaterss,[10 101]);
Tss = exitTs(1); Tjss = exitTs(2);
tfinal = 2000;
T0 = Tss; Tj0 = Tjss;
% Slow response – perturbation in slow direction
% T0 = Tss + 5*ev(1,1); Tj0 = Tjss + 5*ev(2,1);
% Fast response – perturbation in fast direction
% T0 = Tss + 5*ev(1,2); Tj0 = Tjss + 5*ev(2,2);
perturbedT = [T0 Tj0];
[t,TTj] = ode45(@(t,TTj) tankheater(t,TTj), [0 tfinal], perturbedT);
Tvec = TTj(:,1); Tjvec = TTj(:,2);
heattransferred = UA * (Tjvec(numel(t)) – Tvec(numel(t)));
figure;
plot(t,TTj,’o-‘)
xlabel(‘time, s’);
legend(‘Tank Temperature, oC’, ‘Jacket Temperature, oC’)
% Steady-state function
function f = tankheaterss(TTjss)
global Qss Qjss V Vj Tinss Tin Tjinss Tjin cp cpj rho rhoj UA
T = TTjss(1);
Tj = TTjss(2);
f(1) = (Qss/V)*(Tinss-T) + (UA/(rho*V*cp))*(Tj-T);
f(2) = (Qjss/Vj)*(Tjinss-Tj) – (UA/(rhoj*Vj*cpj))*(Tj-T);
end
% Dynamic function
function f = tankheater(t,TTj)
global Q Qj V Vj Tin Tjin cp cpj rho rhoj UA
T = TTj(1);
Tj = TTj(2);
f = zeros(2,1);
f(1) = (Q/V)*(Tin-T) + (UA/(rho*V*cp))*(Tj-T);
f(2) = (Qj/Vj)*(Tjin-Tj) – (UA/(rhoj*Vj*cpj))*(Tj-T);
endclc; clearvars; close all; format short g; format compact;
global Qss Q Qjss Qj V Vj Tinss Tin Tjinss Tjin cp cpj rho rhoj UA
% Q in m^3/s, V in m^3, T in oC, cp in J/kg K, rho in kg/m^3
% Physical properties
rho = 1000; rhoj = 1000; cp = 1269; cpj = 1269; UA = 1796; % J/K s
% Geometric parameters
V = 0.2832; Vj = 0.02832;
% Steady state process parameters
Qss = 4.719e-4; Qjss = 7.078e-4; Tinss = 10; Tjinss = 93.33;
% Actual process parameters
Q = 4.719e-4; Qj = 7.078e-4; Tin = 10; Tjin = 93.33;
% Tss = 51.67; Tjss = 65.56; % in oC (steady-state values from book)
% Linear stability analysis
A11 = -(Qss/V)-(UA/(rho*V*cp));
A12 = (UA/(rho*V*cp));
A21 = (UA/(rhoj*Vj*cpj));
A22 = -(Qjss/Vj)-(UA/(rhoj*Vj*cpj));
A = [A11 A12; A21 A22];
[ev, eval] = eig(A);
exitTs = fsolve(@tankheaterss,[10 101]);
Tss = exitTs(1); Tjss = exitTs(2);
tfinal = 2000;
T0 = Tss; Tj0 = Tjss;
% Slow response – perturbation in slow direction
% T0 = Tss + 5*ev(1,1); Tj0 = Tjss + 5*ev(2,1);
% Fast response – perturbation in fast direction
% T0 = Tss + 5*ev(1,2); Tj0 = Tjss + 5*ev(2,2);
perturbedT = [T0 Tj0];
[t,TTj] = ode45(@(t,TTj) tankheater(t,TTj), [0 tfinal], perturbedT);
Tvec = TTj(:,1); Tjvec = TTj(:,2);
heattransferred = UA * (Tjvec(numel(t)) – Tvec(numel(t)));
figure;
plot(t,TTj,’o-‘)
xlabel(‘time, s’);
legend(‘Tank Temperature, oC’, ‘Jacket Temperature, oC’)
% Steady-state function
function f = tankheaterss(TTjss)
global Qss Qjss V Vj Tinss Tin Tjinss Tjin cp cpj rho rhoj UA
T = TTjss(1);
Tj = TTjss(2);
f(1) = (Qss/V)*(Tinss-T) + (UA/(rho*V*cp))*(Tj-T);
f(2) = (Qjss/Vj)*(Tjinss-Tj) – (UA/(rhoj*Vj*cpj))*(Tj-T);
end
% Dynamic function
function f = tankheater(t,TTj)
global Q Qj V Vj Tin Tjin cp cpj rho rhoj UA
T = TTj(1);
Tj = TTj(2);
f = zeros(2,1);
f(1) = (Q/V)*(Tin-T) + (UA/(rho*V*cp))*(Tj-T);
f(2) = (Qj/Vj)*(Tjin-Tj) – (UA/(rhoj*Vj*cpj))*(Tj-T);
end clc; clearvars; close all; format short g; format compact;
global Qss Q Qjss Qj V Vj Tinss Tin Tjinss Tjin cp cpj rho rhoj UA
% Q in m^3/s, V in m^3, T in oC, cp in J/kg K, rho in kg/m^3
% Physical properties
rho = 1000; rhoj = 1000; cp = 1269; cpj = 1269; UA = 1796; % J/K s
% Geometric parameters
V = 0.2832; Vj = 0.02832;
% Steady state process parameters
Qss = 4.719e-4; Qjss = 7.078e-4; Tinss = 10; Tjinss = 93.33;
% Actual process parameters
Q = 4.719e-4; Qj = 7.078e-4; Tin = 10; Tjin = 93.33;
% Tss = 51.67; Tjss = 65.56; % in oC (steady-state values from book)
% Linear stability analysis
A11 = -(Qss/V)-(UA/(rho*V*cp));
A12 = (UA/(rho*V*cp));
A21 = (UA/(rhoj*Vj*cpj));
A22 = -(Qjss/Vj)-(UA/(rhoj*Vj*cpj));
A = [A11 A12; A21 A22];
[ev, eval] = eig(A);
exitTs = fsolve(@tankheaterss,[10 101]);
Tss = exitTs(1); Tjss = exitTs(2);
tfinal = 2000;
T0 = Tss; Tj0 = Tjss;
% Slow response – perturbation in slow direction
% T0 = Tss + 5*ev(1,1); Tj0 = Tjss + 5*ev(2,1);
% Fast response – perturbation in fast direction
% T0 = Tss + 5*ev(1,2); Tj0 = Tjss + 5*ev(2,2);
perturbedT = [T0 Tj0];
[t,TTj] = ode45(@(t,TTj) tankheater(t,TTj), [0 tfinal], perturbedT);
Tvec = TTj(:,1); Tjvec = TTj(:,2);
heattransferred = UA * (Tjvec(numel(t)) – Tvec(numel(t)));
figure;
plot(t,TTj,’o-‘)
xlabel(‘time, s’);
legend(‘Tank Temperature, oC’, ‘Jacket Temperature, oC’)
% Steady-state function
function f = tankheaterss(TTjss)
global Qss Qjss V Vj Tinss Tin Tjinss Tjin cp cpj rho rhoj UA
T = TTjss(1);
Tj = TTjss(2);
f(1) = (Qss/V)*(Tinss-T) + (UA/(rho*V*cp))*(Tj-T);
f(2) = (Qjss/Vj)*(Tjinss-Tj) – (UA/(rhoj*Vj*cpj))*(Tj-T);
end
% Dynamic function
function f = tankheater(t,TTj)
global Q Qj V Vj Tin Tjin cp cpj rho rhoj UA
T = TTj(1);
Tj = TTj(2);
f = zeros(2,1);
f(1) = (Q/V)*(Tin-T) + (UA/(rho*V*cp))*(Tj-T);
f(2) = (Qj/Vj)*(Tjin-Tj) – (UA/(rhoj*Vj*cpj))*(Tj-T);
end ode23 MATLAB Answers — New Questions
How to interpolate 10 csv files with different x,y,z into a common grid and average them in MATLAB?
Hello,
I have 12 CSV files from a chromatic confocal sensor.
Each file has three columns: x, y, z.
The problem:
Each measurement has different x,y and z positions, since it is spirally scanning. I found x is more deviating than y and z.
I want to create a virtual reference surface by averaging these 12 measurements.
To do that, I need to interpolate each dataset onto the same (x,y) grid before averaging.
My questions:
How can I load all 10 CSVs and interpolate them onto a common regular grid in MATLAB?
2. What is the best function for interpolation in this case (griddata, scatteredInterpolant, or something else)?
3. Once all are on the same grid, how do I average the z-values to get one final reference surface and save it as a CSV?
Any example code or workflow would be greatly appreciated.
Thanks in advance!Hello,
I have 12 CSV files from a chromatic confocal sensor.
Each file has three columns: x, y, z.
The problem:
Each measurement has different x,y and z positions, since it is spirally scanning. I found x is more deviating than y and z.
I want to create a virtual reference surface by averaging these 12 measurements.
To do that, I need to interpolate each dataset onto the same (x,y) grid before averaging.
My questions:
How can I load all 10 CSVs and interpolate them onto a common regular grid in MATLAB?
2. What is the best function for interpolation in this case (griddata, scatteredInterpolant, or something else)?
3. Once all are on the same grid, how do I average the z-values to get one final reference surface and save it as a CSV?
Any example code or workflow would be greatly appreciated.
Thanks in advance! Hello,
I have 12 CSV files from a chromatic confocal sensor.
Each file has three columns: x, y, z.
The problem:
Each measurement has different x,y and z positions, since it is spirally scanning. I found x is more deviating than y and z.
I want to create a virtual reference surface by averaging these 12 measurements.
To do that, I need to interpolate each dataset onto the same (x,y) grid before averaging.
My questions:
How can I load all 10 CSVs and interpolate them onto a common regular grid in MATLAB?
2. What is the best function for interpolation in this case (griddata, scatteredInterpolant, or something else)?
3. Once all are on the same grid, how do I average the z-values to get one final reference surface and save it as a CSV?
Any example code or workflow would be greatly appreciated.
Thanks in advance! interpolation, averaging, csv, combine MATLAB Answers — New Questions
Error when checking data points in plot
I have been running into this issue for some time. I can not hover my mouse over a plot and have the time-value information displayed. I am using ‘plot’ function to display the figure.
I get this warning in the command window:
Error in matlab.graphics.interaction.actions.Linger
Warning: Error occurred while executing the listener callback for event WindowMouseMotion defined for class matlab.ui.Figure:
Undefined function ‘convertDataToPickSpace’ for input arguments of type ‘matlab.graphics.chart.primitive.Line’.
Error in matlab.graphics.chart.interaction.dataannotatable.picking.AnnotatablePicker/convertToPickSpace (line 40)
pickLocations = convertDataToPickSpace(hContext, iter, request3D);
Error in matlab.graphics.chart.interaction.dataannotatable.picking.AnnotatablePicker/nearestSegment (line 39)
pixelLocations = obj.convertToPickSpace(hContext, varargin, valid);
Error in matlab.graphics.chart.interaction.dataannotatable.LineHelper>localGetNearestSegment (line 252)
[index1, index2, t] = utils.nearestSegment(hLine, position, isPixelPoint, data{:});
Error in matlab.graphics.chart.interaction.dataannotatable.LineHelper.getNearestPoint (line 77)
[index1, index2, t] = localGetNearestSegment(hLine, position, true);
Error in matlab.graphics.interaction.uiaxes.DataTipsBase
Error in matlab.graphics.interaction.actions.Linger/motionCallback
Error in matlab.graphics.interaction.actions.Linger
Warning says I have a missing function ‘convertDataToPickSpace’.
Am I missing a toolbox?
I am using MATLAB R2022b, but have the same issue in R2024b.
Thanks in advance!I have been running into this issue for some time. I can not hover my mouse over a plot and have the time-value information displayed. I am using ‘plot’ function to display the figure.
I get this warning in the command window:
Error in matlab.graphics.interaction.actions.Linger
Warning: Error occurred while executing the listener callback for event WindowMouseMotion defined for class matlab.ui.Figure:
Undefined function ‘convertDataToPickSpace’ for input arguments of type ‘matlab.graphics.chart.primitive.Line’.
Error in matlab.graphics.chart.interaction.dataannotatable.picking.AnnotatablePicker/convertToPickSpace (line 40)
pickLocations = convertDataToPickSpace(hContext, iter, request3D);
Error in matlab.graphics.chart.interaction.dataannotatable.picking.AnnotatablePicker/nearestSegment (line 39)
pixelLocations = obj.convertToPickSpace(hContext, varargin, valid);
Error in matlab.graphics.chart.interaction.dataannotatable.LineHelper>localGetNearestSegment (line 252)
[index1, index2, t] = utils.nearestSegment(hLine, position, isPixelPoint, data{:});
Error in matlab.graphics.chart.interaction.dataannotatable.LineHelper.getNearestPoint (line 77)
[index1, index2, t] = localGetNearestSegment(hLine, position, true);
Error in matlab.graphics.interaction.uiaxes.DataTipsBase
Error in matlab.graphics.interaction.actions.Linger/motionCallback
Error in matlab.graphics.interaction.actions.Linger
Warning says I have a missing function ‘convertDataToPickSpace’.
Am I missing a toolbox?
I am using MATLAB R2022b, but have the same issue in R2024b.
Thanks in advance! I have been running into this issue for some time. I can not hover my mouse over a plot and have the time-value information displayed. I am using ‘plot’ function to display the figure.
I get this warning in the command window:
Error in matlab.graphics.interaction.actions.Linger
Warning: Error occurred while executing the listener callback for event WindowMouseMotion defined for class matlab.ui.Figure:
Undefined function ‘convertDataToPickSpace’ for input arguments of type ‘matlab.graphics.chart.primitive.Line’.
Error in matlab.graphics.chart.interaction.dataannotatable.picking.AnnotatablePicker/convertToPickSpace (line 40)
pickLocations = convertDataToPickSpace(hContext, iter, request3D);
Error in matlab.graphics.chart.interaction.dataannotatable.picking.AnnotatablePicker/nearestSegment (line 39)
pixelLocations = obj.convertToPickSpace(hContext, varargin, valid);
Error in matlab.graphics.chart.interaction.dataannotatable.LineHelper>localGetNearestSegment (line 252)
[index1, index2, t] = utils.nearestSegment(hLine, position, isPixelPoint, data{:});
Error in matlab.graphics.chart.interaction.dataannotatable.LineHelper.getNearestPoint (line 77)
[index1, index2, t] = localGetNearestSegment(hLine, position, true);
Error in matlab.graphics.interaction.uiaxes.DataTipsBase
Error in matlab.graphics.interaction.actions.Linger/motionCallback
Error in matlab.graphics.interaction.actions.Linger
Warning says I have a missing function ‘convertDataToPickSpace’.
Am I missing a toolbox?
I am using MATLAB R2022b, but have the same issue in R2024b.
Thanks in advance! plot MATLAB Answers — New Questions
Microsoft Use of Anthropic AI Models Creates Concerns for Tenants
European Union Microsoft 365 Tenants Might Have Highest Level of Concern
On September 24, Microsoft announced an expansion of the AI models used by Microsoft 365 Copilot to include models created and maintained by Anthrophic. Initially, Microsoft says that the Anthrophic Claude Opus 4.1 model can be used with the Copilot Researcher agent, and the Claude Sonnet 4 and Claude Opus 4.1 models can be used to create agents in Copilot Studio. The Anthrophic models are not available in Copilot Chat or other Copilot integrations with Microsoft 365 apps, which continue to use the AI models.
The interesting thing about this change is that it gives Microsoft 365 tenants located in the European Union and elsewhere some issues to consider. Today, Microsoft safeguards the data used in their versions of the OpenAI models to make sure that data does not leave the tenant, compromise the EU data boundary for the Microsoft cloud, or is meets the same standards of privacy and security set down for Copilot.
Although Anthrophic seeks to reassure people about processing information in various locations, no guarantee exist about how using the Anthrophic models with Copilot Researcher or to create Copilot agents maintains the same level of enterprise data protection and integrity that Microsoft has emphasized to date for its AI systems and highlights for the Copilot Researcher agent (Figure 1).

Microsoft Documents the Compliance and Processing Risk
Microsoft’s documentation covering how to connect to the Anthrophic models emphasizes that:
When your organization chooses to use an Anthropic model, your organization is choosing to share your data with Anthropic to power the features. This data is processed outside all Microsoft‑managed environments and audit controls, therefore Microsoft’s customer agreements, including the Product Terms and Data Processing Addendum do not apply. In addition, Microsoft’s data‑residency commitments, audit and compliance requirements, service level agreements, and Customer Copyright Commitment do not apply to your use of Anthropic services. Instead, use of Anthropic’s services is governed by Anthropic’s Commercial Terms of Service and Anthropic’s Data Processing Addendum.
In other words, all bets are off once a tenant goes off the beaten path to explore the glorious uplands of the Anthrophic models. The flat warning given by Microsoft that data will be processed outside the Microsoft environment without any audit controls is stark. It makes other administrative challenges like stopping individual users from uploading files to ChatGPT for processing seem very simple (because uploads are easily blocked).
The loss of all the Microsoft Purview compliance functionality built up around Copilot like the interaction audit records captured by the Microsoft 365 substrate is a big problem. It’s certainly enough to stop all but a few tenants that have a clearly defined and well understood need to use the Anthrophic models from venturing down the path to choose Anthrophic in the Copilot section of the Microsoft 365 admin center (Figure 2).

Where Next?
Choice is always good and Microsoft’s move to expand the pool of available Large Language Models is a worthwhile initiative. Although the targets for the Anthrophic models are currently limited, the guardrails around the use of those models are also limited. Considering the effort expended by Microsoft to develop security and compliance controls for Copilot since the March 2023 launch, it seems that there’s a huge amount of work to be done before third-party models become a serious option for many Microsoft 365 tenants, even in limited circumstances.
The work to bring model choice to Copilot is obviously evolving, and no doubt Microsoft will deliver some of the controls desired by customers over time. Quite how many of the Purview controls can be applied to third-party AI processing remains an open question.
Support the work of the Office 365 for IT Pros team by subscribing to the Office 365 for IT Pros eBook. Your support pays for the time we need to track, analyze, and document the changing world of Microsoft 365 and Office 365. Only humans contribute to our work!
Semi-truck diesel engine modelling with Generic Engine
I used tabulated torque data, and the engine cannot seem to function normally. Trying to model the torque-rpm curve of the engine in the included PDF. Also looked at lookup tables, but with less success. Any ideas how could i replicate the curve with the most realism? Or whats actually wrong with my generic engine block? The linked system is just for trying out, and making the engine itself work. It will be part of a bigger multibody system eventually. Thanks for the help!I used tabulated torque data, and the engine cannot seem to function normally. Trying to model the torque-rpm curve of the engine in the included PDF. Also looked at lookup tables, but with less success. Any ideas how could i replicate the curve with the most realism? Or whats actually wrong with my generic engine block? The linked system is just for trying out, and making the engine itself work. It will be part of a bigger multibody system eventually. Thanks for the help! I used tabulated torque data, and the engine cannot seem to function normally. Trying to model the torque-rpm curve of the engine in the included PDF. Also looked at lookup tables, but with less success. Any ideas how could i replicate the curve with the most realism? Or whats actually wrong with my generic engine block? The linked system is just for trying out, and making the engine itself work. It will be part of a bigger multibody system eventually. Thanks for the help! generic engine MATLAB Answers — New Questions
Introducing Microsoft Marketplace — Thousands of solutions. Millions of customers. One Marketplace.
A new breed of industry-leading company is taking shape — Frontier Firms. These organizations blend human ambition with AI-powered technology to reshape how innovation is scaled, work is orchestrated and value is created. They’re accelerating AI transformation to enrich employee experiences, reinvent customer engagement, reshape business processes and unlock creativity and innovation.
To empower customers in becoming Frontier, we’re excited to announce the launch of the reimagined Microsoft Marketplace, your trusted source for cloud solutions, AI apps and agents. This further realizes Marketplace as an extension of the Microsoft Cloud, where we collaborate with our partner ecosystem to bring their innovations to our customers globally. By offering a comprehensive catalog across cloud solutions and industries, Microsoft Marketplace accelerates the path to becoming a Frontier Firm. With today’s announcement, we are excited to share:
- The new Microsoft Marketplace, a single destination to find, try, buy and deploy cloud solutions, AI apps and agents. Azure Marketplace and Microsoft AppSource are now unified to simplify cloud and AI management. Available today in the US and coming soon to customers worldwide.
- Tens of thousands of cloud and industry solutions in the Marketplace catalog across a breadth of categories ranging from data and analytics to productivity and collaboration, in addition to industry-specific offerings.
- Over 3,000 AI apps and agents are newly available directly on Marketplace and in Microsoft products — from Azure AI Foundry to Microsoft 365 Copilot — with rapid provisioning within your Microsoft environment through industry standards like Model Context Protocol (MCP).
- Marketplace integrations with Microsoft’s channel ecosystem, empowering you to buy where and how you want — whether from your cloud service provider (CSP) or relying on a trusted partner to procure cloud and AI solutions on your behalf.
AI apps and agents for every use case
Microsoft Marketplace gives you access to thousands of AI apps and agents from our rich partner ecosystem designed to automate tasks, accelerate decision-making and unlock value across your business. With a new AI Apps and Agents category, you can easily and confidently find AI solutions that integrate with your organization’s existing Microsoft products.
“With Microsoft Marketplace, we reduced configuration time of AI apps from nearly 20 minutes to just 1 minute per instance. That efficiency boost has translated into increased productivity and lower operating costs. Marketplace is a strategic channel for Siemens, where we’ve seen an 8X increase in customer adoption. It’s a powerful platform for scaling both sides of our business.”
— Jeff Zobrist, VP Global Partner Ecosystem and Go To Market |
Siemens Digital Industries Software
Special thanks to these partners who are launching new AI offerings in Microsoft Marketplace today:

Comprehensive catalog across cloud solutions and industries
Microsoft Marketplace offers solutions across dozens of categories ranging from data and analytics to productivity and collaboration, in addition to industry-specific offerings. Microsoft Marketplace is a seamless extension of the Microsoft Cloud, uniting solutions integrated with Azure, Microsoft 365, Dynamics 365, Power Platform, Microsoft Security and more.
“The Microsoft Marketplace, in particular, helps us balance innovation with confidence by giving us access to trusted solutions that integrate seamlessly with our Azure environment — ultimately enabling us to move faster while staying true to our Five Principles.”
— Matthew Hillegas, Commercial Director – Infrastructure & Information Security |
Mars Inc.
For organizations with a Microsoft Azure Consumption Commitment, 100% of your purchase for any of the thousands of Azure benefit eligible solutions available on Marketplace continue to count toward your commitment. This helps you spend smarter to maximize your cloud and AI investments.
Integrated experience from discovery to deployment
Contextually relevant cloud solutions, AI apps and agents built by our partners are also available directly within Microsoft products — providing users, developers and IT practitioners with approved solutions in the flow of work. For example, Agent Store includes Copilot agents within the Microsoft 365 Copilot experience. The same applies for apps in Microsoft Teams, models and tools in Azure AI Foundry and future experiences including MCP servers.
By integrating offerings from Marketplace directly into the Microsoft Cloud, IT is equipped with management and control tools that enable both innovation and governance. When you acquire a Copilot agent or an app running on Azure from Microsoft Marketplace, it’s provisioned and distributed to team members aligned to your security and governance standards.
Powering partner growth
For our partners, Microsoft Marketplace sits at the center of how we work together. We’re continuously expanding its capabilities to help our partners drive growth — whether that means scaling through digital sales, deepening channel partnerships or landing transformative deals.
We’ve invested in multiparty private offers, CSP integration and CSP private offers to connect software development companies and channel partners on Marketplace, creating more complete solutions to address customers’ needs. Today, we’re excited to share that valued partners including Arrow, Crayon, Ingram Micro, Pax8 and TD SYNNEX are integrating Microsoft Marketplace into their marketplaces, further extending customer reach.
Additionally, a new Marketplace capability called resale enabled offers is now in private preview. This empowers software companies to authorize their channel partners to sell on their behalf through private offers — unlocking new routes to market.
“We’re incredibly excited about the path forward with Microsoft. This integration with the Marketplace catalog is just the beginning — we see endless potential to co-innovate and help customers navigate their AI-first transformation with confidence.”
— Melissa Mulholland, Co-CEO | SoftwareOne and Crayon
Nicole Dezen, Chief Partner Officer and Corporate Vice President, Global Channel Partner Sales at Microsoft, shares more details about the partner opportunity with Microsoft Marketplace in her blog.
Becoming Frontier with Microsoft Marketplace
Whether you’re seeking to accelerate innovation, empower your teams with AI or unlock new value through trusted partners, Microsoft Marketplace brings together the solutions, expertise and ecosystem to meet your business needs. Explore the new Microsoft Marketplace. Thousands of solutions. Millions of customers. One Marketplace.
Alysa Taylor is the Chief Marketing Officer for Commercial Cloud and AI at Microsoft, leading teams that enable digital and AI transformation for organizations of all sizes across the globe. She is at the forefront of helping organizations around the world harness digital and AI innovation to transform how they operate and grow.
NOTE
Source: Work Trend Index Annual Report, 2025: The year the Frontier Firm is born, April 23, 2025
The post Introducing Microsoft Marketplace — Thousands of solutions. Millions of customers. One Marketplace. appeared first on The Official Microsoft Blog.
A new breed of industry-leading company is taking shape — Frontier Firms. These organizations blend human ambition with AI-powered technology to reshape how innovation is scaled, work is orchestrated and value is created. They’re accelerating AI transformation to enrich employee experiences, reinvent customer engagement, reshape business processes and unlock creativity and innovation. To empower customers…
The post Introducing Microsoft Marketplace — Thousands of solutions. Millions of customers. One Marketplace. appeared first on The Official Microsoft Blog. Read More
Six-Phase PMSM FEA Block Working as Motor
Hello,
I work on dual three-phase PMSM simulation. Now, I have exported flux linkage LUTs as function of current and angle from Ansys Maxwell, and loaded them to my MATLAB workspace.
I would like to take benefit from this ready Mathworks example, which connects Motor-CAD data of 6-phase machine to Simscape simulation with the help of a customized Simscape block: https://www.mathworks.com/help/sps/ug/import-fem-motorcad-six_phase.html
But the problem is, that this customized block is implemented as a generator in this example! Can I still use it directly as a motor, just by applying voltages as input and reading mechanical quantities on outputs (i.e. by cchanging the energy flow)?? Or should I make changes on the core equations inside the block?? Maybe people who developed this example can answer me in the best way possible.
I appreciate any effort to help.
Thank you in advance,
Ali BashabshehHello,
I work on dual three-phase PMSM simulation. Now, I have exported flux linkage LUTs as function of current and angle from Ansys Maxwell, and loaded them to my MATLAB workspace.
I would like to take benefit from this ready Mathworks example, which connects Motor-CAD data of 6-phase machine to Simscape simulation with the help of a customized Simscape block: https://www.mathworks.com/help/sps/ug/import-fem-motorcad-six_phase.html
But the problem is, that this customized block is implemented as a generator in this example! Can I still use it directly as a motor, just by applying voltages as input and reading mechanical quantities on outputs (i.e. by cchanging the energy flow)?? Or should I make changes on the core equations inside the block?? Maybe people who developed this example can answer me in the best way possible.
I appreciate any effort to help.
Thank you in advance,
Ali Bashabsheh Hello,
I work on dual three-phase PMSM simulation. Now, I have exported flux linkage LUTs as function of current and angle from Ansys Maxwell, and loaded them to my MATLAB workspace.
I would like to take benefit from this ready Mathworks example, which connects Motor-CAD data of 6-phase machine to Simscape simulation with the help of a customized Simscape block: https://www.mathworks.com/help/sps/ug/import-fem-motorcad-six_phase.html
But the problem is, that this customized block is implemented as a generator in this example! Can I still use it directly as a motor, just by applying voltages as input and reading mechanical quantities on outputs (i.e. by cchanging the energy flow)?? Or should I make changes on the core equations inside the block?? Maybe people who developed this example can answer me in the best way possible.
I appreciate any effort to help.
Thank you in advance,
Ali Bashabsheh six-phase pmsm, fem-parametrized MATLAB Answers — New Questions
Is it possible to generate C code with Embedded Coder (ERT TLC) following the Google C style guide?
Hello,
I am using Embedded Coder with the ERT TLC file to generate C code from Simulink models.
I would like to know if it is possible to configure the code generator so that the generated functions and source files comply with the Google C Style Guide.
In particular, I am interested in:
Function naming conventions
Indentation and formatting rules
File structure and organization
Is there any built-in support for this, or would it require customizing TLC files and code generation templates?
Any references or examples would be very helpful.
Thank you in advance!Hello,
I am using Embedded Coder with the ERT TLC file to generate C code from Simulink models.
I would like to know if it is possible to configure the code generator so that the generated functions and source files comply with the Google C Style Guide.
In particular, I am interested in:
Function naming conventions
Indentation and formatting rules
File structure and organization
Is there any built-in support for this, or would it require customizing TLC files and code generation templates?
Any references or examples would be very helpful.
Thank you in advance! Hello,
I am using Embedded Coder with the ERT TLC file to generate C code from Simulink models.
I would like to know if it is possible to configure the code generator so that the generated functions and source files comply with the Google C Style Guide.
In particular, I am interested in:
Function naming conventions
Indentation and formatting rules
File structure and organization
Is there any built-in support for this, or would it require customizing TLC files and code generation templates?
Any references or examples would be very helpful.
Thank you in advance! embedded coder, google style, standard MATLAB Answers — New Questions
Implement data type propagation for custom block
After some discussion and playing around, I got some ways in defining a block mask that sets the Simulink (fixed point) data type of an output. i have a mask parameter called "quotype" that is a Data Type parameter, and I can pass a related parameter into my MATLAB Function block that has that data type which can then be acted upon. However, I’d like to support rules such as "Inherit: Inherit via internal rule" and "Inherit: Inherit via back propagation". To do so, I need to be able to retrieve information on the signals/ports as they’re compiling in Mask call back function. To wit: I have the current code that for instance works correctly when a specific data type is invoked:
% Initialization code section
function initialization()
if ~isa(quotype,’Simulink.NumericType’)
ports = get_param(gcb,"PortHandles");
out1 = ports.Outport(1);
in1 = ports.Inport(1);
in2 = ports.Inport(2);
disp(ports)
switch quotype
case ‘Inherit: Inherit via internal rule’
ttmp = fixdt(0,10,2);
case ‘Inherit: Inherit via back propagation’
ttmp = fixdt(0,10,2);
case ‘Inherit: Same as first input’
ttmp = fixdt(0,10,2);
otherwise
disp(quotype)
ttmp = fixdt(0,10,2);
end
qtype = fi(0,ttmp);
else
qtype = fi(0,quotype);
end
end
So, if a specific numeric type is provided in the dialog, I see I get a Simulink.NumericType object and life is good. If one of the other rules is selected, I get a string. As you can see, I can access stuff like the block port handles, but they’re doubles not objects so I have no idea what to do next. I can’t run this in the debugger apparently so I’m limited to my disp() statements that put stuff in the Diagnostic Viewer. The qtype is passed as a parameter into the underlying MATLAB function and the numeric type can be re-fetched by the call fixed.extractNumericType().
Help!After some discussion and playing around, I got some ways in defining a block mask that sets the Simulink (fixed point) data type of an output. i have a mask parameter called "quotype" that is a Data Type parameter, and I can pass a related parameter into my MATLAB Function block that has that data type which can then be acted upon. However, I’d like to support rules such as "Inherit: Inherit via internal rule" and "Inherit: Inherit via back propagation". To do so, I need to be able to retrieve information on the signals/ports as they’re compiling in Mask call back function. To wit: I have the current code that for instance works correctly when a specific data type is invoked:
% Initialization code section
function initialization()
if ~isa(quotype,’Simulink.NumericType’)
ports = get_param(gcb,"PortHandles");
out1 = ports.Outport(1);
in1 = ports.Inport(1);
in2 = ports.Inport(2);
disp(ports)
switch quotype
case ‘Inherit: Inherit via internal rule’
ttmp = fixdt(0,10,2);
case ‘Inherit: Inherit via back propagation’
ttmp = fixdt(0,10,2);
case ‘Inherit: Same as first input’
ttmp = fixdt(0,10,2);
otherwise
disp(quotype)
ttmp = fixdt(0,10,2);
end
qtype = fi(0,ttmp);
else
qtype = fi(0,quotype);
end
end
So, if a specific numeric type is provided in the dialog, I see I get a Simulink.NumericType object and life is good. If one of the other rules is selected, I get a string. As you can see, I can access stuff like the block port handles, but they’re doubles not objects so I have no idea what to do next. I can’t run this in the debugger apparently so I’m limited to my disp() statements that put stuff in the Diagnostic Viewer. The qtype is passed as a parameter into the underlying MATLAB function and the numeric type can be re-fetched by the call fixed.extractNumericType().
Help! After some discussion and playing around, I got some ways in defining a block mask that sets the Simulink (fixed point) data type of an output. i have a mask parameter called "quotype" that is a Data Type parameter, and I can pass a related parameter into my MATLAB Function block that has that data type which can then be acted upon. However, I’d like to support rules such as "Inherit: Inherit via internal rule" and "Inherit: Inherit via back propagation". To do so, I need to be able to retrieve information on the signals/ports as they’re compiling in Mask call back function. To wit: I have the current code that for instance works correctly when a specific data type is invoked:
% Initialization code section
function initialization()
if ~isa(quotype,’Simulink.NumericType’)
ports = get_param(gcb,"PortHandles");
out1 = ports.Outport(1);
in1 = ports.Inport(1);
in2 = ports.Inport(2);
disp(ports)
switch quotype
case ‘Inherit: Inherit via internal rule’
ttmp = fixdt(0,10,2);
case ‘Inherit: Inherit via back propagation’
ttmp = fixdt(0,10,2);
case ‘Inherit: Same as first input’
ttmp = fixdt(0,10,2);
otherwise
disp(quotype)
ttmp = fixdt(0,10,2);
end
qtype = fi(0,ttmp);
else
qtype = fi(0,quotype);
end
end
So, if a specific numeric type is provided in the dialog, I see I get a Simulink.NumericType object and life is good. If one of the other rules is selected, I get a string. As you can see, I can access stuff like the block port handles, but they’re doubles not objects so I have no idea what to do next. I can’t run this in the debugger apparently so I’m limited to my disp() statements that put stuff in the Diagnostic Viewer. The qtype is passed as a parameter into the underlying MATLAB function and the numeric type can be re-fetched by the call fixed.extractNumericType().
Help! mask parameters, port signals MATLAB Answers — New Questions
Matlab calculations randomly take forever to run, not represented in tic toc
Hello all, I have a weird issue I was wondering if someone might have some idea on how to fix. I’m running Matlab 2024b on a Dell XPS 14 laptop. My issue is that seemingly randomly (perhaps 1 out every 6-10 operations) Matlab takes forever to run selected lines of code (or anything at all). For instance, I just ran this line of code:
tic
ECR_PBO_Support_1 = [];
ECR_PBO_Support_2 = [norm_2_32_PBO_Support01.ECR, norm_2_32_PBO_Support02.ECR, norm_2_32_PBO_Support03.ECR, norm_2_32_PBO_Support04.ECR, norm_2_32_PBO_Support05.ECR,…
norm_2_32_PBO_Support06.ECR, norm_2_32_PBO_Support07.ECR, norm_2_32_PBO_Support08.ECR];
ECR_PBO_Support_Total = [ECR_PBO_Support_1,ECR_PBO_Support_2];
toc
What the data is is irrelevant (its ultimately 8 vectors of 100 numbers long). But when I ran these lines, Matlab took about 5-8 seconds to run (i.e. it displays ‘Busy". Even though the output of tic toc was:
Elapsed time is 0.015314 seconds.
For the life of me, I cannot figure out why Matlab is doing this, but its causing me to really slow down since even the most basic operations will randomly take 5-8 seconds to run. When it happens, the delay affects everything, calculations, plots etc.
Has anyone experienced this before or have any suggestions for settings to check?Hello all, I have a weird issue I was wondering if someone might have some idea on how to fix. I’m running Matlab 2024b on a Dell XPS 14 laptop. My issue is that seemingly randomly (perhaps 1 out every 6-10 operations) Matlab takes forever to run selected lines of code (or anything at all). For instance, I just ran this line of code:
tic
ECR_PBO_Support_1 = [];
ECR_PBO_Support_2 = [norm_2_32_PBO_Support01.ECR, norm_2_32_PBO_Support02.ECR, norm_2_32_PBO_Support03.ECR, norm_2_32_PBO_Support04.ECR, norm_2_32_PBO_Support05.ECR,…
norm_2_32_PBO_Support06.ECR, norm_2_32_PBO_Support07.ECR, norm_2_32_PBO_Support08.ECR];
ECR_PBO_Support_Total = [ECR_PBO_Support_1,ECR_PBO_Support_2];
toc
What the data is is irrelevant (its ultimately 8 vectors of 100 numbers long). But when I ran these lines, Matlab took about 5-8 seconds to run (i.e. it displays ‘Busy". Even though the output of tic toc was:
Elapsed time is 0.015314 seconds.
For the life of me, I cannot figure out why Matlab is doing this, but its causing me to really slow down since even the most basic operations will randomly take 5-8 seconds to run. When it happens, the delay affects everything, calculations, plots etc.
Has anyone experienced this before or have any suggestions for settings to check? Hello all, I have a weird issue I was wondering if someone might have some idea on how to fix. I’m running Matlab 2024b on a Dell XPS 14 laptop. My issue is that seemingly randomly (perhaps 1 out every 6-10 operations) Matlab takes forever to run selected lines of code (or anything at all). For instance, I just ran this line of code:
tic
ECR_PBO_Support_1 = [];
ECR_PBO_Support_2 = [norm_2_32_PBO_Support01.ECR, norm_2_32_PBO_Support02.ECR, norm_2_32_PBO_Support03.ECR, norm_2_32_PBO_Support04.ECR, norm_2_32_PBO_Support05.ECR,…
norm_2_32_PBO_Support06.ECR, norm_2_32_PBO_Support07.ECR, norm_2_32_PBO_Support08.ECR];
ECR_PBO_Support_Total = [ECR_PBO_Support_1,ECR_PBO_Support_2];
toc
What the data is is irrelevant (its ultimately 8 vectors of 100 numbers long). But when I ran these lines, Matlab took about 5-8 seconds to run (i.e. it displays ‘Busy". Even though the output of tic toc was:
Elapsed time is 0.015314 seconds.
For the life of me, I cannot figure out why Matlab is doing this, but its causing me to really slow down since even the most basic operations will randomly take 5-8 seconds to run. When it happens, the delay affects everything, calculations, plots etc.
Has anyone experienced this before or have any suggestions for settings to check? processing time, matlab, script, speed, optimization MATLAB Answers — New Questions
SharePoint Knowledge Agent Available in Preview
Knowledge Agent to Sort Out SharePoint Metadata
With all the associated hype that’s now the norm for a Microsoft announcement associated with AI, the SharePoint development group launched the preview of the SharePoint Knowledge Agent on September 18, 2025. You think “so what” because SharePoint has supported agents for almost a year. However, those agents reason over the content of files found in a site while the big difference with the Knowledge Agent is that it deals with site metadata and its purpose is to make sites work better rather than to help users find information.
Given Microsoft’s promise that the new agent could help stream content management (aka, sort out the mess that’s in so many sites) to “SharePoint into a dynamic, intelligent knowledge hub that gives your organization a competitive edge,” it seemed like a good thing to test. That is, if you have a Microsoft 365 Copilot license.
Enabling a Microsoft 365 Tenant for the SharePoint Knowledge Agent
With the licensing issue out of the way, the next step is to enable the tenant to support the Knowledge Agent. This can be done for all or selected sites, as described in the documentation. Enabling Knowledge Agent can only be done through PowerShell at this point, and throwing caution to the breeze, I elected for all sites and ran this command after connecting to SharePoint Online:
Set-SPOTenant -KnowledgeAgentScope AllSites
Using the SharePoint Knowledge Agent
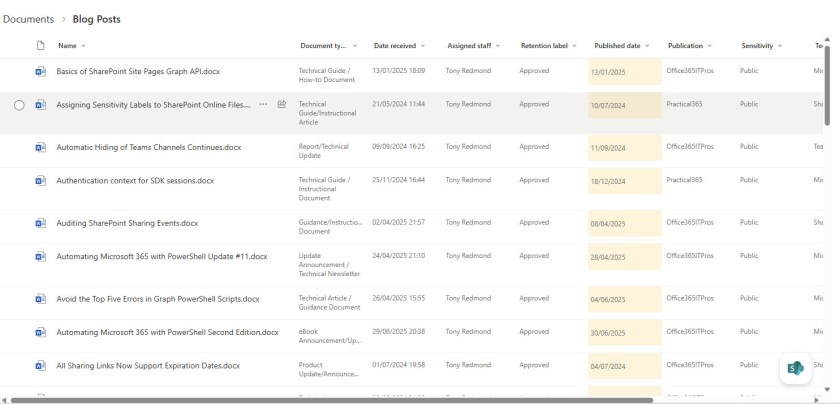
There’s no point in testing any software against just a few objects, so I started by testing the Knowledge Agent against a site containing roughly 4,000 files in 10.2 GB of storage. The Knowledge Agent has its own floating action menu, which appears on top of the regular document view (Figure 1).

Given my notorious lack of organization, the Organize this library option seemed like a good place to start. The options (Figure 2) include creating three columns to hold metadata that the agent will generate to make the library easier for Microsoft 365 Copilot to process, creating a rule to do something when an action happens in the library, extract key actions from files to populate an autofill column, and summarize files.

I asked the Knowledge Agent to create some suitable columns. The document library already has some custom columns that I use to organize and search articles that I’ve written. As such, you might think that the library is already well-organized. The agent thought for a bit and then suggested that the library could use columns for the document type, date received, and assigned staff. If you agree, the agent adds the new columns to the existing view or creates a new view that includes the columns.
The important thing is that these are autofill columns. SharePoint auto-fills the properties for new files when they are created, and to backfill the properties for older files, background processes use the Copilot LLMs to generate the necessary information (Figure 3). The backfill process doesn’t happen immediately, and full population of the columns for all items can take a few days. The categorization of articles into document type was the most interesting part of the exercise, but nothing was gained from the date received (date the item was uploaded to SharePoint) and assigned staff (always me) columns.
The extract key actions and summarize options also use autofill columns to hold their results. The summaries are like the automatic summaries created by Copilot for Word documents. There’s no indication of if or how often the agent checks files for new or changed text to update the metadata and the autofill status doesn’t provide too much insight into what’s happening. Mostly, the autofill status showed information about processing that occurred over eight hours ago even when it was obvious that the agent had processed files more recently. In Figure 4, the agent updated the summary (for this article) but the autofill activity page lagged way behind.

Obviously, if the agent can’t extract text to summarize, it cannot populate these columns, so expect good results from Office and PDF files and lesser joy elsewhere. The agent experienced some problems with Word documents translated into Japanese by the SharePoint translation service, but on the upside, the agent stripped text nicely out of JPEG files to report what it found there.
Creating a rule calls the standard SharePoint feature, so there’s not much to say about it except that the agent possibly makes it a little easier for people to create rules. However, if they want to make changes to the rule, they’ll still need to go to SharePoint’s Automate menu, select Rules, and then Manage rules.
No Audit Records for Agent Processing
Unlike when humans create SharePoint agents, there’s no trace of Knowledge Agent activity in the audit log. This is perhaps unsurprising because the creation of SharePoint agents is only auditable by checking FileUploaded audit events for .agent files. Other workloads, including Exchange Online, create audit records when background processes perform actions that affect users, so I don’t know why SharePoint Online lags in this respect.
No Real Magic
The Knowledge Agent is a preview and who knows what the final version will deliver. For now, I find little trace of any magic generated by AI in what the Knowledge Agent delivers. But it’s entirely possible that my testing did not cover the kind of scenarios that Microsoft envisages the agent delivering most value, like classifying legal documents, or to help HR organize the resumes for job applicants.
I would have liked to try the agent out on sites with different types of information, but even though the Knowledge Agent is enabled for all sites, its action menu is only available in the first site I chose for testing (the situation persists a week after enabling the Knowledge Agent). There’s got to be something simple that’s going wrong here, but I can’t find an answer to the case of the missing action menu.
Insight like this doesn’t come easily. You’ve got to know the technology and understand how to look behind the scenes. Benefit from the knowledge and experience of the Office 365 for IT Pros team by subscribing to the best eBook covering Office 365 and the wider Microsoft 365 ecosystem.
Distinguish installed MATLAB from Online/Mobile versions
MATLAB has commands such as ispc/ismac/isunix and computer to determine the local computing environment. Is there a way to distinguish MATLAB Online and MATLAB Mobile from a local install? Both the online and mobile versions report themselves as 64-bit Linux, which is presumably the Mathworks server running behind the scenes. Both also have an enviroment variable MW_DDUX_APP_NAME that does not appear on Mac or Windows installs, with the very telling value MATLAB_ONLINE. My assumption is that a local Linux install would not have that variable, and if a local server did, the value would be different (unless one was running MATLAB Online behind a firewall).
So far I haven’t found a simple way of separating online and mobile versions, apart from a try/catch block containing a command that does not work on the latter (such as uifigure). That’s not very robust–is there a better way?MATLAB has commands such as ispc/ismac/isunix and computer to determine the local computing environment. Is there a way to distinguish MATLAB Online and MATLAB Mobile from a local install? Both the online and mobile versions report themselves as 64-bit Linux, which is presumably the Mathworks server running behind the scenes. Both also have an enviroment variable MW_DDUX_APP_NAME that does not appear on Mac or Windows installs, with the very telling value MATLAB_ONLINE. My assumption is that a local Linux install would not have that variable, and if a local server did, the value would be different (unless one was running MATLAB Online behind a firewall).
So far I haven’t found a simple way of separating online and mobile versions, apart from a try/catch block containing a command that does not work on the latter (such as uifigure). That’s not very robust–is there a better way? MATLAB has commands such as ispc/ismac/isunix and computer to determine the local computing environment. Is there a way to distinguish MATLAB Online and MATLAB Mobile from a local install? Both the online and mobile versions report themselves as 64-bit Linux, which is presumably the Mathworks server running behind the scenes. Both also have an enviroment variable MW_DDUX_APP_NAME that does not appear on Mac or Windows installs, with the very telling value MATLAB_ONLINE. My assumption is that a local Linux install would not have that variable, and if a local server did, the value would be different (unless one was running MATLAB Online behind a firewall).
So far I haven’t found a simple way of separating online and mobile versions, apart from a try/catch block containing a command that does not work on the latter (such as uifigure). That’s not very robust–is there a better way? online, mobile MATLAB Answers — New Questions
RF PCB toolbox analysis inconsistency.
Hi,
I’ve been developing an application using the RF PCB Toolbox for quite some time. Essentially, the application creates a microstrip resonator based on parameters provided by the user and then analyzes its scattering parameters using the Method of Moments (MOM) algorithm. However, my results vary depending on the frequency range of the analysis. The resonator’s frequency response changes in completely unrelated ways, and I can’t figure out why this is happening. My code is intentionally kept simple, without any custom mesh settings or advanced solver configurations.
function SingleLoadedAnalyzeButtonPushed(app, event)
app.FBegin = (app.FBeginField.Value)*1e9;
app.FEnd = (app.FEndField.Value)*1e9;
app.FPoints = (app.FPointsField.Value);
fsweep = linspace(app.FBegin,app.FEnd,app.FPoints);
if app.InterpOptionCheck.Value == 1
interpOption = "interp";
else
interpOption = "direct";
end
spar = sparameters(app.singleResonator,fsweep,…
"SweepOption",interpOption);
rfplot(app.EMResponsePlot,spar);
end
Has anyone experienced similar issues with RF PCB Toolbox for microstrip resonators?Hi,
I’ve been developing an application using the RF PCB Toolbox for quite some time. Essentially, the application creates a microstrip resonator based on parameters provided by the user and then analyzes its scattering parameters using the Method of Moments (MOM) algorithm. However, my results vary depending on the frequency range of the analysis. The resonator’s frequency response changes in completely unrelated ways, and I can’t figure out why this is happening. My code is intentionally kept simple, without any custom mesh settings or advanced solver configurations.
function SingleLoadedAnalyzeButtonPushed(app, event)
app.FBegin = (app.FBeginField.Value)*1e9;
app.FEnd = (app.FEndField.Value)*1e9;
app.FPoints = (app.FPointsField.Value);
fsweep = linspace(app.FBegin,app.FEnd,app.FPoints);
if app.InterpOptionCheck.Value == 1
interpOption = "interp";
else
interpOption = "direct";
end
spar = sparameters(app.singleResonator,fsweep,…
"SweepOption",interpOption);
rfplot(app.EMResponsePlot,spar);
end
Has anyone experienced similar issues with RF PCB Toolbox for microstrip resonators? Hi,
I’ve been developing an application using the RF PCB Toolbox for quite some time. Essentially, the application creates a microstrip resonator based on parameters provided by the user and then analyzes its scattering parameters using the Method of Moments (MOM) algorithm. However, my results vary depending on the frequency range of the analysis. The resonator’s frequency response changes in completely unrelated ways, and I can’t figure out why this is happening. My code is intentionally kept simple, without any custom mesh settings or advanced solver configurations.
function SingleLoadedAnalyzeButtonPushed(app, event)
app.FBegin = (app.FBeginField.Value)*1e9;
app.FEnd = (app.FEndField.Value)*1e9;
app.FPoints = (app.FPointsField.Value);
fsweep = linspace(app.FBegin,app.FEnd,app.FPoints);
if app.InterpOptionCheck.Value == 1
interpOption = "interp";
else
interpOption = "direct";
end
spar = sparameters(app.singleResonator,fsweep,…
"SweepOption",interpOption);
rfplot(app.EMResponsePlot,spar);
end
Has anyone experienced similar issues with RF PCB Toolbox for microstrip resonators? rf pcb toolbox, microstrip, method of moments MATLAB Answers — New Questions
UniqueTol Exclusion of Similar Points
I am trying to remove detected circles that are too close to one another. My original plan involved indexing through all of the centers (X Y stored in separate columns), determining the distances, and then using those to remove points within a tolerance.
for nn=1:height(location_table)
distances=sqrt(((location_table(nn,1) – location_table(:,1)).^2)+((location_table(nn,2) – location_table(:,2)).^2))
too_close=(0<distances & distances<tolerance);
location_table(too_close,:)=[]
end
I was never able to get the removal to work. It would end up breaking if spots were removed because the index nn would eventually get larger than the current table height.
I discovered the uniquetol command when searching for answers. However, in my use of it, it filters out spots that are not unique (ie, within the tolerance). However, I would want it to remove spots that all spots that are too similar (rather than leaving a representative one behind).
location_table=uniquetol(location_table, closeness_tolerance, ‘ByRows’, true, ‘OutputAllIndices’, true, ‘DataScale’,1);
I plan to do radial intensity line scans starting at the center of all circles (and proceeding past their perimeter by a variable) that make it through this filtering process. If spots are too close, then the scan (improfile) will cross over the border of the intended scan as well as a spot that is too close to it (which will skew the data). For example, circle 4 should be excluded because it is too close to other circles and its scans could be skewed. Uniquetold allowed me to exclude the nearby circles but 4 would ideally not be included either.I am trying to remove detected circles that are too close to one another. My original plan involved indexing through all of the centers (X Y stored in separate columns), determining the distances, and then using those to remove points within a tolerance.
for nn=1:height(location_table)
distances=sqrt(((location_table(nn,1) – location_table(:,1)).^2)+((location_table(nn,2) – location_table(:,2)).^2))
too_close=(0<distances & distances<tolerance);
location_table(too_close,:)=[]
end
I was never able to get the removal to work. It would end up breaking if spots were removed because the index nn would eventually get larger than the current table height.
I discovered the uniquetol command when searching for answers. However, in my use of it, it filters out spots that are not unique (ie, within the tolerance). However, I would want it to remove spots that all spots that are too similar (rather than leaving a representative one behind).
location_table=uniquetol(location_table, closeness_tolerance, ‘ByRows’, true, ‘OutputAllIndices’, true, ‘DataScale’,1);
I plan to do radial intensity line scans starting at the center of all circles (and proceeding past their perimeter by a variable) that make it through this filtering process. If spots are too close, then the scan (improfile) will cross over the border of the intended scan as well as a spot that is too close to it (which will skew the data). For example, circle 4 should be excluded because it is too close to other circles and its scans could be skewed. Uniquetold allowed me to exclude the nearby circles but 4 would ideally not be included either. I am trying to remove detected circles that are too close to one another. My original plan involved indexing through all of the centers (X Y stored in separate columns), determining the distances, and then using those to remove points within a tolerance.
for nn=1:height(location_table)
distances=sqrt(((location_table(nn,1) – location_table(:,1)).^2)+((location_table(nn,2) – location_table(:,2)).^2))
too_close=(0<distances & distances<tolerance);
location_table(too_close,:)=[]
end
I was never able to get the removal to work. It would end up breaking if spots were removed because the index nn would eventually get larger than the current table height.
I discovered the uniquetol command when searching for answers. However, in my use of it, it filters out spots that are not unique (ie, within the tolerance). However, I would want it to remove spots that all spots that are too similar (rather than leaving a representative one behind).
location_table=uniquetol(location_table, closeness_tolerance, ‘ByRows’, true, ‘OutputAllIndices’, true, ‘DataScale’,1);
I plan to do radial intensity line scans starting at the center of all circles (and proceeding past their perimeter by a variable) that make it through this filtering process. If spots are too close, then the scan (improfile) will cross over the border of the intended scan as well as a spot that is too close to it (which will skew the data). For example, circle 4 should be excluded because it is too close to other circles and its scans could be skewed. Uniquetold allowed me to exclude the nearby circles but 4 would ideally not be included either. uniquetol, image analysis, image processing MATLAB Answers — New Questions
configure Java path for MATLAB, MATLAB Runtime and deployed applications
MATLAB ships with one specific version of the JRE. This version is validated and fully supported with MATLAB.
However, you can configure MATLAB to use other version of JRE by following this article. Since R2021b, jenv and matlab_jenv commands are introduced to set Java path for MATLAB, which makes this configuration process much easier.
If I used either command and configured MATLAB to use a non-default JRE, how will it impact deployed applications that this MATLAB compiles?
Can I configure JRE for MATLAB Runtime?MATLAB ships with one specific version of the JRE. This version is validated and fully supported with MATLAB.
However, you can configure MATLAB to use other version of JRE by following this article. Since R2021b, jenv and matlab_jenv commands are introduced to set Java path for MATLAB, which makes this configuration process much easier.
If I used either command and configured MATLAB to use a non-default JRE, how will it impact deployed applications that this MATLAB compiles?
Can I configure JRE for MATLAB Runtime? MATLAB ships with one specific version of the JRE. This version is validated and fully supported with MATLAB.
However, you can configure MATLAB to use other version of JRE by following this article. Since R2021b, jenv and matlab_jenv commands are introduced to set Java path for MATLAB, which makes this configuration process much easier.
If I used either command and configured MATLAB to use a non-default JRE, how will it impact deployed applications that this MATLAB compiles?
Can I configure JRE for MATLAB Runtime? MATLAB Answers — New Questions
suprisingly complicated optimization problem
I have the following constrained (global) optimization problem:
For a user defined sorted real values vector:
xi = [xi(1), … , xi(N+1)]
I need to find unknown vector:
x = [x(1), …, x(L)]
where the integer L is the unknown length of the vector x (L>=0, L = 0 is the trivial case)
and the unknown vector x = [x(1), …, x(L)] must satisfy the following specific conditions:
===============================================================
0. The new "refined" sorted vector xo = union(xi,x), where length(xo) = L+N+1
should to fulfil the following set of conditions:
1. min(xo) = xo(1) = xi(1), max(xo) = xo(L+N+1) = xi(N+1)
2a. max(z(j)/z(j+1),z(j+1)/z(j)) < q_max, for j = 1, 2, … L+N
2b. max(z(j-1)/z(j),z(j)/z(j-1)) < q_max, for j = 2, 2, … L+N+1
where
z(j) = xo(j+1) – xo(j) , z = diff(xo), length(z) = L+N
and
q_max is user defined max ratio, where q_max > 1 (typically q_max ~ 1.05 – 1.2)
3. min(z) -> maximal, minimal distance between xo vector elements should be maximized.
It is obvious that for small L the constraint conditions (2) is not possible to satisfy.
===============================================================
The motivation of this problem is the creation of the so called, "homogenized" 1-D grid, where consecutive distances between elements of vector xo are relatively "slowly" changing.
I will be very happy for any recommendation how to effectively solve this problem using MATLAB + (global) optimization toolbox.I have the following constrained (global) optimization problem:
For a user defined sorted real values vector:
xi = [xi(1), … , xi(N+1)]
I need to find unknown vector:
x = [x(1), …, x(L)]
where the integer L is the unknown length of the vector x (L>=0, L = 0 is the trivial case)
and the unknown vector x = [x(1), …, x(L)] must satisfy the following specific conditions:
===============================================================
0. The new "refined" sorted vector xo = union(xi,x), where length(xo) = L+N+1
should to fulfil the following set of conditions:
1. min(xo) = xo(1) = xi(1), max(xo) = xo(L+N+1) = xi(N+1)
2a. max(z(j)/z(j+1),z(j+1)/z(j)) < q_max, for j = 1, 2, … L+N
2b. max(z(j-1)/z(j),z(j)/z(j-1)) < q_max, for j = 2, 2, … L+N+1
where
z(j) = xo(j+1) – xo(j) , z = diff(xo), length(z) = L+N
and
q_max is user defined max ratio, where q_max > 1 (typically q_max ~ 1.05 – 1.2)
3. min(z) -> maximal, minimal distance between xo vector elements should be maximized.
It is obvious that for small L the constraint conditions (2) is not possible to satisfy.
===============================================================
The motivation of this problem is the creation of the so called, "homogenized" 1-D grid, where consecutive distances between elements of vector xo are relatively "slowly" changing.
I will be very happy for any recommendation how to effectively solve this problem using MATLAB + (global) optimization toolbox. I have the following constrained (global) optimization problem:
For a user defined sorted real values vector:
xi = [xi(1), … , xi(N+1)]
I need to find unknown vector:
x = [x(1), …, x(L)]
where the integer L is the unknown length of the vector x (L>=0, L = 0 is the trivial case)
and the unknown vector x = [x(1), …, x(L)] must satisfy the following specific conditions:
===============================================================
0. The new "refined" sorted vector xo = union(xi,x), where length(xo) = L+N+1
should to fulfil the following set of conditions:
1. min(xo) = xo(1) = xi(1), max(xo) = xo(L+N+1) = xi(N+1)
2a. max(z(j)/z(j+1),z(j+1)/z(j)) < q_max, for j = 1, 2, … L+N
2b. max(z(j-1)/z(j),z(j)/z(j-1)) < q_max, for j = 2, 2, … L+N+1
where
z(j) = xo(j+1) – xo(j) , z = diff(xo), length(z) = L+N
and
q_max is user defined max ratio, where q_max > 1 (typically q_max ~ 1.05 – 1.2)
3. min(z) -> maximal, minimal distance between xo vector elements should be maximized.
It is obvious that for small L the constraint conditions (2) is not possible to satisfy.
===============================================================
The motivation of this problem is the creation of the so called, "homogenized" 1-D grid, where consecutive distances between elements of vector xo are relatively "slowly" changing.
I will be very happy for any recommendation how to effectively solve this problem using MATLAB + (global) optimization toolbox. optmization, constrained MATLAB Answers — New Questions
Assembly Clashes Make Microsoft 365 PowerShell Frustrating
Assembly Clashes Happen too Often
In June, I reported a problem with V3.8 of the Exchange Online management PowerShell module when called by Azure Automation runbooks. The problem was caused by the removal of .NET6 support in the Exchange Online module, which meant that runbooks using the PowerShell V7.1 or V7.2 runtime engines couldn’t load. The Microsoft Graph PowerShell SDK did the same thing with the same effect, proving that developers don’t look much outside their own software to discover how problems might occur when software dependencies change.
The Authentication Assembly Dependency
Complex software often has some form of dependency. In the case above, it was the version of .NET that caused problems. New .NET versions appear and have a support schedule, so it’s understandable that software products should move to the latest supported version and want to discard versions that are no longer supported. What’s not understandable is when engineers make changes with no regard to what might happen to customer production scripts.
But an even more irritating problem that continues to happen is Microsoft’s failure to sort out the use of .NET assemblies across important PowerShell modules like the Microsoft Graph PowerShell SDK, Exchange Online management, and Microsoft Teams.
All the modules need to authenticate connections, so they call the Microsoft Authentication Library (MSAL) and load the Microsoft.Identity.Client assembly to allow clients to authenticate. An assembly is a building block for .NET applications. In this instance, the MSAL assembly contains the code necessary to allow an application (like a PowerShell module) to authenticate with Entra ID and obtain the necessary access tokens to work with data.
Connecting with Exchange and then the Graph
Sometimes the Microsoft 365 PowerShell modules fail to use the same version of the assembly, which means that an older version can be loaded into a session and cause a problem for a module loaded afterwards. Take this example using V3.9 of the Exchange Online management module and V2.30 of the Microsoft Graph PowerShell SDK:
PowerShell 7.5.3

Connect-Exchangeonline -showBanner:$false

Connect-MgGraph -NoWelcome

Connect-MgGraph: InteractiveBrowserCredential authentication failed: Method not found: '!0 Microsoft.Identity.Client.BaseAbstractApplicationBuilder`1.WithLogging(Microsoft.IdentityModel.Abstractions.IIdentityLogger, Boolean)'.
Connect-ExchangeOnline runs first and authenticates, so the MSAL assembly it requires is loaded into the session. When Connect-MgGraph runs, it checks for a method that doesn’t exist in the loaded MSAL assembly and barfs. Microsoft’s support guidance for the Microsoft Graph PowerShell SDK recommends using the latest bits, but this problem happened with the latest available release.
The problem goes away if Connect-MgGraph is run before Connect-ExchangeOnline. When this happens, the Graph has the assembly it needs and the Exchange module is happy to use the later version of MSAL.
A Known Problem for Years
Assembly clashing between PowerShell modules has been a known problem for years. A recent issue posted to GitHub notes that Microsoft does not implement assembly loading properly because all assemblies are loaded globally (and so affect all modules loaded into the session) rather than in an application context (just for one module).
The mismatch of MSAL assemblies has been an issue for quite a while (here’s a similar problem report from August 2023). To be fair to Exchange Online, the Azure Accounts module has also experienced assembly clashing with the Microsoft Graph PowerShell SDK.
To be fair to the Microsoft Graph PowerShell SDK, assembly clashing is known between Exchange Online and Microsoft Teams. Figure 1 shows what happens when you attempt to run the Connect-MicrosoftTeams cmdlet (V7.3.1) after running Connect-ExchangeOnline:

It’s kind of weird that Connect-MicrosoftTeams isn’t recognized as a cmdlet. Everything works perfectly when Connect-MicrosoftTeams runs before Connect-ExchangeOnline.
No Change Without Consensus
Assembly clashes will continue until the Microsoft engineering groups coordinate development better to ensure common usage of important .NET assemblies. It doesn’t take much to communicate what version of an assembly a module needs so that everyone can reach consensus on the version modules use. Maybe Copilot could help. In the interim, the only solution is to make sure that the order scripts load modules doesn’t cause a problem, and to repeat that check after each release of important modules.
Identify and refill dark spots on the leopard with neighboring pixels
Remove the dark spots on the leopard.
i tried converting the color image into grayscale.Applied ostu thresholding to create binary image.
using the morophological operations i was able to create a mask, used mask to refilll the black spots on the color image. i did not get the desired result.
what other steps i can implement to achieve an image with no black spotsRemove the dark spots on the leopard.
i tried converting the color image into grayscale.Applied ostu thresholding to create binary image.
using the morophological operations i was able to create a mask, used mask to refilll the black spots on the color image. i did not get the desired result.
what other steps i can implement to achieve an image with no black spots Remove the dark spots on the leopard.
i tried converting the color image into grayscale.Applied ostu thresholding to create binary image.
using the morophological operations i was able to create a mask, used mask to refilll the black spots on the color image. i did not get the desired result.
what other steps i can implement to achieve an image with no black spots image processing, image segmentation, hole filling MATLAB Answers — New Questions
The student has not been able to complete the creation of her account because it is blocked. How long will she have to wait before trying to create her account again?
I have a student who tried to create her account but entered the wrong university email address. When she retried with the correct email and set up her password, that part worked. However, when she attempted to log in, she received an error message saying the account was blocked. She then tried to change her password and enter the authentication code, but in all cases the attempts were rejected.
How long will she have to wait before trying to create her account again?
Thank you very much in advance for your help.I have a student who tried to create her account but entered the wrong university email address. When she retried with the correct email and set up her password, that part worked. However, when she attempted to log in, she received an error message saying the account was blocked. She then tried to change her password and enter the authentication code, but in all cases the attempts were rejected.
How long will she have to wait before trying to create her account again?
Thank you very much in advance for your help. I have a student who tried to create her account but entered the wrong university email address. When she retried with the correct email and set up her password, that part worked. However, when she attempted to log in, she received an error message saying the account was blocked. She then tried to change her password and enter the authentication code, but in all cases the attempts were rejected.
How long will she have to wait before trying to create her account again?
Thank you very much in advance for your help. account blocked MATLAB Answers — New Questions


