

Observability on Azure Container Apps
What is Observability
Our systems can sometimes be a black box. We toss a request into it and get something back, but what goes on inside? Cutting through the tech jargon, observability is a measure of how well we understand the system from the outside looking in.
You might wonder, isn’t that monitoring? Well, not quite. Monitoring tells you when something is wrong, like if your CPU is overloaded or if there’s a glitch slowing things down (that’s the “What”). Observability, on the other hand, is like being a detective. It helps you understand the story behind the problem (the “Why”).
Let’s say an app is responding slowly. We might have all these cool charts and graphs showing us the problem, but do they tell us why it’s happening? Not always.
That’s where solid observability comes in, giving us better visibility into our systems, which in turn solves problems faster. And when we solve problems faster, our customers are happier because they get a smoother, more reliable experience.
What to Measure
Let’s break down what we really need to measure to get a good grip on what’s happening inside our system, without all the fancy terms.
Think of observability as our way of understanding the system from the outside. To do that, we need data, right? So, what kind of data should we collect?
There are three main things, often called the pillars of observability:
Metrics: These are the numbers that tell us something specific, like how much memory is left or how hard the CPU is working. It’s like checking the speedometer and fuel gauge in your car.
Logs: Ever written a simple program and used a print statement to see what’s going on? That’s logging in a nutshell. It’s a record of events, in words. People still to this day (me, to be precise), still debug by adding print statements in their code.
Traces: Tracing is about tracking a request’s route through your system. As the request moves through the system, it generates logs & metrics at each step (remember, we still want to collect these). The crucial part of tracing is that each request has a Trace ID — a tag that sticks with it from beginning to end. This Trace ID is important because it ties every piece of data — all logs and metrics — back to that particular request, no matter where it wanders off to in your system. When a request sets off other actions or calls out to more processes, these offspring processes get their own ID, known as a Parent ID. The Parent ID serves as a reminder of where it came from, linking it to the initial request. The Trace ID is the glue that keeps the entire journey in check, while Parent IDs map out the family tree, showing how each subprocess is part of the larger operation. With this setup, you can follow a request’s entire trip from when it knocks on the door to when it leaves your system.
Observability Strategy
A robust observability strategy involves several key components:
Instrumentation: Instrumentation is the process of capturing telemetry (metrics, logs, and traces) in your code, and is arguably the part that requires the biggest investment. There are many SDKs (libraries) and even codeless (agent based) tools out there that do that automatically (more on that later).
Export: You need to have the capability to gather all this telemetry data, whether it’s from the application itself or the operating system, and then send it off to a specific place.
Centralized Repository: A repository that can store logs, metrics, and link all these together by taking into consideration the traces we instrumented.
Visualize and Query: This is about having the tools to look at the data in your centralized repository and make sense of it. You should be able to search through it and see it in a way that’s easy to understand.
Take Action: This is the proactive part of the strategy. When the data shows that certain limits are being hit or surpassed, your system should either automatically adjust itself (like increasing resources if the CPU is overworked) or ping the engineers to take a look and decide what to do.
One key requirement in a good observability strategy: Every part of your system should be measured. That is easier said than done, but there are tools that can help.
Azure Monitor Overview
This blog will get too long if I delve deep into Azure Monitor, but I’ll provide a high level summary.
Azure Monitor is an Azure native observability tool which allows you to collect metrics & logs from various resources (applications, Azure resources, Activity logs, etc.), stores them in a centralized repository like Azure Log Analytics, and give you the capability to configure alerts.
Using instrumentation libraries provided by Azure Monitor, we can also collect traces from our applications.
Azure Container Apps Observability Overview
To recap, we want to collect metrics, logs, and traces and we need to meet the requirement of having every part of our system measured. Thankfully, Azure Container Apps, makes it easy to meet that requirement.
With Azure Container Apps, we can collect:
Application Level Logs, metrics, and traces: Application level logs using Open Telemetry SDK. Collecting things such as request/response times, exceptions, etc and can be sent to a centralized repository (Azure Log Analytics).
Container Level Logs: Your containers will generate logs (outside of the application), known as stout & sterr.
System Logs: The Container Apps resource itself, generates logs to inform you of “service level” events. Things such as volume mounts, traffic splits, etc. Anything you do at the resource level.
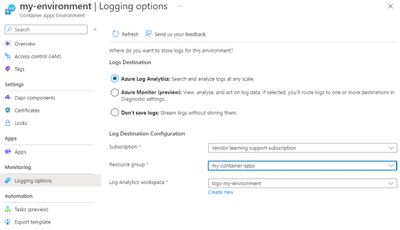
Note: While Container Level Logs & Sytem Logs are collected & streamed automatically (and can be viewed in near real time), you can choose to route them to Azure Log Analytics (for querying purpose), or you can leverage Diagnostic Settings to send the logs to an Azure Storage Account, or Event Hub (to be then consumed by a third party app).
4. Resource Metrics: Every Azure resource emits metrics automatically, known as standard metrics. In Azure Container Apps, these include things like CPU usage, Requests, Network in (measured in bytes), etc. You can then use Metrics explorer to view these metrics.
Instrumentation with OpenTelemetry & Azure Application Insights (Application Level)
OpenTelemetry stands out in the cloud-native scene as a go-to choice for instrumentation. It’s a community-powered, open-source project aimed at standardizing how we collect and handle telemetry data, which includes logs, metrics, and traces.
What makes OpenTelemetry stand out is its vendor-agnostic nature, which means you’re not tied down to any specific platform; you can gather your telemetry data and send it off to any destination. For instance, in the scenario we’re discussing, the data could be sent to Azure Monitor (Azure Application Insights) or anywhere else.
Microsoft, being a major contributor to Open Source, supports an OpenTelemetry-specific SDK and actually suggests opting for this SDK over the classical Azure Application Insights SDK. While it’s possible to set up an OpenTelemetry (OTEL) collector on your own and direct it to Azure Application Insights, Microsoft doesn’t back this method. They endorse using Azure’s own OTEL SDKs because they come with Microsoft’s support and additional capabilities like Live Metrics (coming soon), Microsoft Entra authentication, and standard Application Insights metrics. You can even customize the SDK to send it to a second destination simultaneously. There isn’t a very good reason to use native Open Telemetry especially if you’re using Azure Container Apps anyway.
Example Application Overview with Dapr
Our application is simple, it will retrieve a collection of Products with the properties of name & amount/stock. Behind the scenes, however, I deliberately overcomplicated it to simulate a distributed system communicating asynchronously. Technically though, this is all synchronous communication as we will build our own dummy event bus.
We will have 3 main services:
Product Service: Responsible for returning back a list of all products with their associated inventory.
Inventory Service: Responsible for tracking & updating inventory of products created by Product Service.
Events Service: Responsible for acting as an event bus.
The services will talk to each other through events. If inventory is updated for a specific product, an event is emitted by the inventory service, gets sent to the Events service, and Events service will push that to the Products Service to display the correct amount of inventory.
We are using Dapr for service-service invocation. Again, outside of buzzwords, Dapr offloads common logic such as service-service communication, network retries, error handling, state management, and many others into a container running side by side with your main application container (hence, called, sidecar container). With common functionalities handled by the sidecar, your application becomes easier to maintain and update, as changes to these functionalities can often be made without altering your application code. In your code, you can focus on business logic.
Example Application Setup
The repo can be found on: AbdullahAbuHassann/ACA-Observability: Azure Container Apps Observability with Open Telemetry (github.com)
Prerequisites
Create an Azure Log Analytics Workspace, an Azure Application Insights Resource an Azure Container Registry resource. Make sure when you create the Application Insights resource, you pick the same Log Analytics resource that you created.
Take note of Azure Application Insights Connection String on the overview page in the portal.
Create a Resource Group, and take note of the name.
Ensure Docker is installed locally on your machine.
Setup
Login to Azure (make sure Azure CLI is installed)
az login
2. Authenticate to the Azure Container Registry (you might need to provide credentials, which you can get from the portal)
az acr login –name myregistry
3. Clone the repository locally
git clone https://github.com/AbdullahAbuHassann/ACA-Observability.git
4. Configure Products Service
Navigate to /products. In the config.ts file, replace the connection string property with your connection string noted in the Prerequisites section.
const options: AzureMonitorOpenTelemetryOptions = {
azureMonitorExporterOptions: {
connectionString: “REPLACE_WITH_CONNECTION_STRING”,
}
};
Now, we will build a docker container from the provided Dockerfile, replace ACRName below as appropriate (make sure you are inside /products).
docker build -t <ACRName>.azurecr.io/products:v1 .
Push the container to Azure
docker push <ACRName>.azurecr.io/products:v1 .
Repeat step 4 with /inventory and /events (ensure different image names are used)
5. Setup Bicep Template
Navigate to /infra/appinsights.bicep and replace fill in appInsightsName and workspaceResourceId
param location string = ‘westeurope’ // You can change the location as needed
param appInsightsName string = ‘<App Insights Resource Name>’ // Provide a unique name for the Application Insights resource
param workspaceResourceId string = ‘<Resource ID of the Log Analytics workspace>’ // Provide the resource ID of the Log Analytics workspace
resource appInsights ‘Microsoft.Insights/components@2020-02-02-preview’ = {
name: appInsightsName
location: location
kind: ‘web’
properties: {
Application_Type: ‘web’
WorkspaceResourceId: workspaceResourceId
}
}
Navigate to /infra/aca.bicep and adjust environmentName, acrName, Log Analytics Workspace Id & Key, Image names, RG Name for the scope of the user managed identity, and daprAIConnectionString
param environmentName string = ‘<ACA Environment Name>’ // Provide an Azure Container Apps Environment unique name
param acrName string = ‘<ACR Name>’ // Your Azure Container Registry name
// Assuming the managed environment is in the same resource group and subscription
var environmentId = resourceId(‘Microsoft.App/managedEnvironments’, environmentName)
param location string = ‘westeurope’ // Change as needed
param logAnalyticsCustomerId string = ‘<Workspace ID>’// Provide Log Analytics Workspace Customer ID
param logAnalyticsSharedKey string = ‘<Workspace Key>’ // Provide Log Analytics Workspace Shared Key
param inventoryImage string = ‘<Image Name>’ // Provide the image name without the ACR name prefix, example: ‘inventory:v1’
param eventsImage string = ‘<Image Name>’ // Provide the image name without the ACR name prefix, example: ‘events:v1’
param productsImage string = ‘<Image Name>’ // Provide the image name without the ACR name prefix, example: ‘products:v1’
// Assign AcrPull permission
module roleAssignment ‘roleassignment.bicep’ = {
name: ‘container-registry-role-assignment’
scope: resourceGroup(‘<RG Name>’) //Replace Value
params: {
roleId: ‘7f951dda-4ed3-4680-a7ca-43fe172d538d’ // AcrPull
principalId: userManagedIdentity.properties.principalId
registryName: acrName
}
}
// Azure Container Apps Environment
resource containerAppEnvironment ‘Microsoft.App/managedEnvironments@2023-05-01’ = {
name: environmentName
location: location
properties: {
appLogsConfiguration: {
destination: ‘log-analytics’
logAnalyticsConfiguration: {
customerId: logAnalyticsCustomerId
sharedKey: logAnalyticsSharedKey
}
}
daprAIConnectionString: ‘<App Insights Connection String>’
}
}
6. Deploy Bicep template
Ensure you are on /infra and run (replace with your resource group name you created previously):
az deployment group create –resource-group <RG_Name> –template-file aca.bicep
To tidy up, delete the resource group later on
az group delete –n <RG_Name> –yes
7. Test the Application
You should now have 3 Azure Container Apps running each with their unique URL.
Use Postman or any HTTP/s client to simulate these requests:
1. Getting a list of Products: GET /
2. Updating a specific product Inventory (with ID 1 in this example): POST /1/inventory {“amount”: “2”}
Analysis
You should now be able to view the collected logs, metrics, and traces on Azure Application Insights (leveraging Azure Log Analytics under the hood). Here’s an overview of what you can leverage
Azure Application Map: Remember, there’s a reason we’re collecting traces from our applications. It’s because with services like Azure Application Map looking at trace IDs, it can map out the entire journey of the request. We can easily identify where the bottleneck is.
2. Investigating Failures: This is a view that takes advantage of the logs, metrics, and traces we collect and focuses on failures (400s & 500s status codes) & exceptions.
3. Investigating Performance: A view focused on performance, grouping requests by duration.
4. Querying collected telemetry:
5. Setting up Availability Tests:
6. Setting up Alerts
Practical Example of Finding the Root Cause on Azure Container Apps
We’ve done the hard work and set everything up. How do we now, moving forward, practically find the root cause assuming we’re facing an issue?
Here’s a straightforward guide to follow:
Alert fired: First off, it’s key to have your alerts set up correctly. Make sure you’ve defined clearly what situations should trigger an alert.
Dashboards: When an alert goes off, it’s just a starting point. Let’s say it’s about slow response times. Our users are experiencing delays, but in a complex system, where do we start troubleshooting? This is where well-designed dashboards come into play. Begin with dashboards that focus on customer experience — how they interact with your services, what works, and what doesn’t. This is the kind of dashboard you’d share with your business team. Then, drill down to the system’s entry points like the UI or frontend, and then to the backend. Azure Monitor provides pre-built dashboards through Azure Workbooks: Azure Workbooks overview — Azure Monitor | Microsoft Learn
Application Map: With the insights gained from the dashboards about the alert, it’s time to leverage the traces we’ve collected. The Application Map, which shows how services communicate with each other, will pinpoint exactly where the issue lies.
Specific Logs & Metrics: Once we’ve identified the problematic component or service, we focus on its specific logs and metrics, moving beyond the general dashboards. Logs offer a deeper dive than metrics, providing more layers of information (known as dimensions). They allow us to dissect the data through queries for more precise analysis.
Conclusion
To wrap things up, it’s crucial to have a solid observability strategy for Azure Container Apps. This approach arms your engineers with the necessary insights to quickly address customer issues, leading to happier customers.
Remember, observability doesn’t have to be a complex affair. There are tools available to simplify the process, but the key is having the right strategy. Hopefully, this blog post has provided you with a solid foundation to develop your observability strategy for Azure Container Apps.
Microsoft Tech Community – Latest Blogs –Read More


