

Category: News
Reducing Windows 10, version 22H2 Monthly LCU package size
If you’re using Windows 10, you’re about to experience a significant increase in efficiency.
Microsoft releases security and quality updates for Windows every month, resulting in a substantial amount of content that can quickly consume the network bandwidth of users operating on slower networks. To reduce the demands on your network, Microsoft is now taking a page from the Windows 11 playbook and reducing the size of Windows 10 update packages.
Windows 10 is becoming more like Windows 11
Windows 11 cumulative updates are more efficient than update packages for Windows 10. This is achieved through efficient packaging, including the removal of reverse differentials from the cumulative update package. To understand how the update size for Windows 11 is reduced, refer to How Microsoft reduced Windows 11 update size by 40%.
Microsoft is bringing the same functionality to Windows 10, version 22H2, thereby decreasing the size of the monthly Latest Cumulative Update (LCU) package. This feature will be available starting with the April 23, 2024 (KB5036979) monthly release, which helps you and your organization to conserve network bandwidth.
Simply approve and apply the update as you would do today. Devices on Windows, version 10 22H2 will observe a dip in size from 830 MB in the April 9, 2024 (KB5036892) release to approximately 650 MB in the April 23, 2024 (KB5036979) release.
Make sure you’re ready
This reduction of the LCU package size offers advantages such as reduced bandwidth usage, faster downloads, minimized network traffic, and improved performance on slow connections. If you maintain Windows 10, version 22H2 for deployment to new devices, make sure you’re ready for these improvements by taking the following steps:
Check to see if you have serviced your image since the July 23, 2024 update (KB5028244).
If you have not, apply standalone SSU KB5031539.
After this, apply an April 23 or later quality update.
Continue the conversation. Find best practices. Bookmark the Windows Tech Community, then follow us @MSWindowsITPro on X/Twitter. Looking for support? Visit Windows on Microsoft Q&A.
Microsoft Tech Community – Latest Blogs –Read More
Revoking vulnerable Windows boot managers
If you’re worried about the BlackLotus UEFI bootkit vulnerability (CVE-2023-24932) and how it might affect your device’s security, you’ll be pleased to learn about the measures Microsoft is taking to help keep you safe.
Back in February, we shared steps you can take to prepare to update the Secure Boot trust anchors for Windows, as the existing ones are approaching expiry. With the update to the Secure Boot trust anchor, we can address the threat of all previous, potentially vulnerable Windows boot components by revoking the old trust anchor. To this effect, the April 9 security updates includes a new Secure Boot revocation update (DBX).
If you’re interested in applying this revocation on systems with the updated trust anchors, this article describes how to do just that. For now, we strongly recommend the steps in this article for testing and validation only.
The security benefits of Secure Boot
Secure Boot is a security feature in the Unified Extensible Firmware Interface (UEFI) that helps ensure that only trusted software runs during the system’s boot sequence. We recommend the use of Secure Boot to help make a safe and trusted path from UEFI through the Windows kernels’ Trusted Boot sequence.
As an industry standard, UEFI’s Secure Boot defines how platform firmware manages certificates and authenticates firmware, and how the operating system (OS) interfaces with this process. For more details on UEFI and Secure Boot, refer to the Secure Boot page.
Secure Boot’s main focus is to help protect the pre-boot environment from bootkit malware. A bootkit is a malicious program designed to load as early as possible in a device’s boot sequence. Secure Boot helps ensure that only verified code executes before Windows. Verified code is firmware that runs early in the boot sequence, initializes the PC prior to the launch of Windows OS, and is trusted based on certificates configured in the firmware. Examples include UEFI firmware drivers, bootloaders, applications, and option ROMs (Read-Only Memory). Disabling Secure Boot puts a device at high risk of infection by bootkit malware.
Addressing the BlackLotus malware
The BlackLotus malware exploits a known security vulnerability called “Baton Drop,” tracked by CVE-2022-21894. It bypasses Secure Boot and then installs malicious files to the EFI (Extensible Firmware Interface) System Partition (ESP), which are then launched by the UEFI firmware. Baton Drop allows rollback of Windows boot managers to previous vulnerable versions that are not in the Secure Boot Forbidden Signature Database (DBX). It then exploits the vulnerability in Windows boot manager as part of an attack. For more information, refer to Guidance for investigating attacks using CVE-2022-21894: The BlackLotus campaign.
Windows boot manager mitigations that we released previously
To address this vulnerability, as part of the May 2023 servicing updates, we introduced a code integrity policy that blocked vulnerable Windows boot managers based on their version number. For versions of Windows boot manager that remained unaffected by this fix, we added them to the DBX.
However, we have found multiple cases that can bypass the rollback protections released during the May 2023 servicing updates. As a result, we are putting forth a more comprehensive solution that involves revoking the Microsoft Windows Production PCA (Product Certificate Authority) 2011.
New measures to help secure Windows boot managers
Here are the next steps to help protect against the malicious abuse of vulnerable Windows boot managers:
What we’re doing: As our current trust anchors are expiring in 2026, we’re already migrating to new ones (catch up on this in KB5036210: Deploying Windows UEFI CA 2023 certificate to Secure Boot Allowed Signature Database). This transition allows us to revoke trust for the Windows signing certificate, Microsoft Windows Production PCA 2011. This Product Certificate authority (PCA) is currently used to authorize trust for all Windows boot managers in Secure Boot.
What you can do: Once you’ve followed the steps in KB5036210 to add the new Windows trust anchor, you can follow the optional steps below to revoke trust in the Windows Production PCA 2011. Note that the earlier KB cautions that these updates should be done on “representative sample test devices” first. At this time, we strongly recommend the same cautious approach. Take the steps described in this article on “representative sample test devices” before attempting to perform these steps on production devices.
Guidelines for evaluating the Secure Boot DBX update
Understand the upcoming changes
By applying the DBX update to a secure boot enabled device, that device will no longer be able to boot from any Windows boot manager signed by the Microsoft Windows Production PCA 2011. This includes booting through existing recovery media, USB media, and network boot (WSD/PXE/HTTP) servers that do not have updated boot manager components. PXE boot is especially likely to be impacted. That’s because you cannot update the binaries served by PXE until all machines supported by the network boot server are updated to run with the new DB update.
Plan the deployment
To prepare your device to receive the DBX update package, ensure that you have applied the DB update package first and deployed the new updated boot manager components signed by the Microsoft Windows UEFI CA 2023. Refer to KB5025885: How to manage the Windows boot manager revocations for Secure Boot changes associated with CVE-2023-24932 for more details.
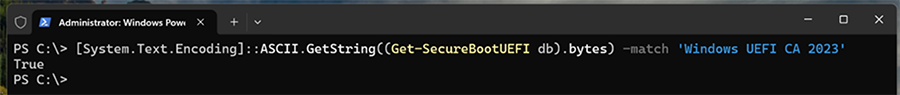
Confirm that your device has successfully applied the DB update package first. Open a PowerShell console and ensure that PowerShell is running as an administrator before running the following command: [System.Text.Encoding]::ASCII.GetString((Get-SecureBootUEFI db).bytes) -match ‘Windows UEFI CA 2023′
Screenshot of a PowerShell console with a command string.
If the command returns “True,” the update was successful. In the case of errors while applying the DB update, refer to the article, KB5016061: Addressing vulnerable and revoked Boot Managers.
After applying the April servicing updates, begin by testing the updates with individual devices. Test on the same firmware and specifications in the enterprise environment to minimize the risks in the case of firmware bugs in your devices.
Verify that your UEFI firmware version is the most recent available version by your firmware vendor or OEM.
For data backup steps, refer to this guide.
If you use BitLocker, or if your enterprise has deployed BitLocker on your machine, Back up your BitLocker recovery key. See this portal to ensure that your BitLocker keys are backed up before your next reboot for your selfhost device. In the unlikely event that device becomes inoperable after receiving the update, you can still unlock the hard drive.
For devices with third party full device or disk encryption, check with your disk encryption provider to perform your own set of tests before applying the update packages.
For detailed instructions on applying the DBX updates, refer to KB5025885: How to manage the Windows boot manager revocations for Secure Boot changes associated with CVE-2023-24932.
Why you need to update the DB before applying the DBX update
Note: You cannot apply the DBX update package through Windows updates on a device without first applying the DB update.
As part of the planning for the DB and DBX update packages, Microsoft, in collaboration with some of our OEM partners, has conducted extensive testing on various device configurations to detect and resolve any bugs in firmware implementations that could cause system failures or render a device unreceptive to these update packages. Despite our thorough testing, we acknowledge that we cannot cover every possible device configuration, so we strongly recommend customers to perform their own tests on their devices before applying the DB and DBX update packages.
Some of the associated risks with applying the DBX update package before updating the DB update package include:
The device firmware might encounter difficulties in processing the DB and DBX updates, leading to operational issues. In the handful of cases that we’ve encountered, we’ve notified the OEMs of the issue and blocked those devices from applying both DB and DBX updates until the issue can be remedied.
While unlikely, you might inadvertently cause BitLocker to enter recovery and lose Virtualization-based Security (VBS) protected secrets that are used by Windows Hello or Credential Guard.
Updating the PXE server to use 2023 signed binaries without applying the DB update first will cause the system to fail to boot, and inversely, applying the DBX update package will prevent any 2011 signed media from booting.
DO NOT apply the DBX to a device without DB update through manual update, using set-securebootuefi, as the system will not boot. Specifically, this will bypass the safety checks included in our servicing tool (Windows Updates) to guard against breaking issues. Update your device by relying on our published mitigations.
Continuing the journey of trust
In short, to establish new trust anchors, you need to untrust the Microsoft Windows Production PCA 2011. These updates are only a part of Microsoft’s ongoing dedication to security. Microsoft anticipates releasing DBX updates in the future, with a goal of achieving mandatory enforcement no sooner than January 2025. We encourage IT admins and enterprise customers to invest in building workflows that ensure an efficient rollout of these updates across their device fleet.
Make sure you’re getting the most out of your security experience by checking out the following resources:
KB5025885: How to manage the Windows boot manager revocations for Secure Boot changes associated with CVE-2023-24932
Guidance for investigating attacks using CVE-2022-21894: The BlackLotus campaign
Updating Microsoft Secure Boot keys
Azure Security best practices and pattern
What are custom security attributes in Microsoft Entra ID?
Secure the Windows boot process
Windows operating system security
Continue the conversation. Find best practices. Bookmark the Windows Tech Community, then follow us @MSWindowsITPro on X/Twitter. Looking for support? Visit Windows on Microsoft Q&A.
Microsoft Tech Community – Latest Blogs –Read More
Vectorize nested for loops with indices and subscripts
How can I vectorize these nested loops?
A=[1 2 0 2;2 1 3 0;0 3 1 3;2 0 3 1];
matArray=unifrnd(-1,1,[4,4,10]);
m=size(matArray,3);
n=size(unique(A),1)-1;
out=zeros(m,n);
for i = 1 : m
mat=matArray(:,:,i);
for j = 1 : n
out(i,j) = sum(mat(A(:)==j));
end
end
Imo, the main challenge seems to be that if I vectorize i, then I don’t seem how to combine indices and subscripts for mat(A(:)==j) to work. I guess one option could be to arrange m copies of A in the same shape as matArray but I am not sure whether that is the best approach.How can I vectorize these nested loops?
A=[1 2 0 2;2 1 3 0;0 3 1 3;2 0 3 1];
matArray=unifrnd(-1,1,[4,4,10]);
m=size(matArray,3);
n=size(unique(A),1)-1;
out=zeros(m,n);
for i = 1 : m
mat=matArray(:,:,i);
for j = 1 : n
out(i,j) = sum(mat(A(:)==j));
end
end
Imo, the main challenge seems to be that if I vectorize i, then I don’t seem how to combine indices and subscripts for mat(A(:)==j) to work. I guess one option could be to arrange m copies of A in the same shape as matArray but I am not sure whether that is the best approach. How can I vectorize these nested loops?
A=[1 2 0 2;2 1 3 0;0 3 1 3;2 0 3 1];
matArray=unifrnd(-1,1,[4,4,10]);
m=size(matArray,3);
n=size(unique(A),1)-1;
out=zeros(m,n);
for i = 1 : m
mat=matArray(:,:,i);
for j = 1 : n
out(i,j) = sum(mat(A(:)==j));
end
end
Imo, the main challenge seems to be that if I vectorize i, then I don’t seem how to combine indices and subscripts for mat(A(:)==j) to work. I guess one option could be to arrange m copies of A in the same shape as matArray but I am not sure whether that is the best approach. vectorization, indexing MATLAB Answers — New Questions
Visualization of decision tree
I have a table in which all of its columns are categorical variables, and the label associated with them is also a categorical variable. I use this piece of code to fit a tree to the data:
Mdld = fitctree(X,Ycat,’MaxNumSplits’,5,’PredictorSelection’,’curvature’,…
‘CrossVal’,’on’);
when I plot the tree, the variables will be converted to a ordinal variable which is hard to track back what is the original variables that I had in table X. You can see the results here:
view(Mdld.Trained{1},’Mode’,’graph’)
As you see, the labels are correct, but for example, in the X table, I have "Small" and "Large" categories for vessel radius, but I get 1 and 2 labels instead, for which I event do not know readily which one is which!
I could not find a way to keep the labels on the node. Can anyone help me to do so?I have a table in which all of its columns are categorical variables, and the label associated with them is also a categorical variable. I use this piece of code to fit a tree to the data:
Mdld = fitctree(X,Ycat,’MaxNumSplits’,5,’PredictorSelection’,’curvature’,…
‘CrossVal’,’on’);
when I plot the tree, the variables will be converted to a ordinal variable which is hard to track back what is the original variables that I had in table X. You can see the results here:
view(Mdld.Trained{1},’Mode’,’graph’)
As you see, the labels are correct, but for example, in the X table, I have "Small" and "Large" categories for vessel radius, but I get 1 and 2 labels instead, for which I event do not know readily which one is which!
I could not find a way to keep the labels on the node. Can anyone help me to do so? I have a table in which all of its columns are categorical variables, and the label associated with them is also a categorical variable. I use this piece of code to fit a tree to the data:
Mdld = fitctree(X,Ycat,’MaxNumSplits’,5,’PredictorSelection’,’curvature’,…
‘CrossVal’,’on’);
when I plot the tree, the variables will be converted to a ordinal variable which is hard to track back what is the original variables that I had in table X. You can see the results here:
view(Mdld.Trained{1},’Mode’,’graph’)
As you see, the labels are correct, but for example, in the X table, I have "Small" and "Large" categories for vessel radius, but I get 1 and 2 labels instead, for which I event do not know readily which one is which!
I could not find a way to keep the labels on the node. Can anyone help me to do so? decision tree, view, visualize, categorical variables MATLAB Answers — New Questions
Unzipping MDF4 files and combining them into 1
I am trying unzip a collection of mdf4 files, combine them into 1 mdf4 file and save it. I am getting the following error (attached):
‘Time_10Hz’ does exist in the dataset as shown (attached)
Any help would be appreciated! Code is attached below
% Open file selection dialog to choose MDF files
[fileNames, folderPath] = uigetfile(‘*.mdf;*.zip’, ‘Select MDF or ZIP files’, ‘MultiSelect’, ‘on’);
if ~ischar(fileNames) % Check if any file is selected
combinedData = struct(); % Initialize an empty structure to store combined data
for i = 1:numel(fileNames)
filePath = fullfile(folderPath, fileNames{i});
% Check if the file is a ZIP archive
if endsWith(filePath, ‘.zip’)
% Unzip the archive to a temporary folder
tempFolder = tempname;
unzip(filePath, tempFolder);
% Find the MDF file(s) in the temporary folder
mdfFiles = dir(fullfile(tempFolder, ‘*.mdf’));
for j = 1:numel(mdfFiles)
mdfFilePath = fullfile(tempFolder, mdfFiles(j).name);
data = mdfimport(mdfFilePath);
% Extract desired channel groups and signals
desiredChannelGroups = {’32’}; % Replace with your desired channel groups
desiredSignals = {‘YawRate’, ‘EPBMode’}; % Replace with your desired signals
for k = 1:numel(desiredChannelGroups)
channelGroup = desiredChannelGroups{k};
if isfield(data, channelGroup)
for l = 1:numel(desiredSignals)
signal = desiredSignals{l};
if isfield(data.(channelGroup), signal)
if isfield(combinedData, [channelGroup ‘.’ signal])
combinedData.([channelGroup ‘.’ signal]) = [combinedData.([channelGroup ‘.’ signal]), data.(channelGroup).(signal)];
else
combinedData.([channelGroup ‘.’ signal]) = data.(channelGroup).(signal);
end
end
end
end
end
end
% Clean up the temporary folder
rmdir(tempFolder, ‘s’);
else
% Import the MDF file directly
data = mdfimport(filePath);
% Extract desired channel groups and signals
desiredChannelGroups = {’32’}; % Replace with your desired channel groups
desiredSignals = {‘YawRate’, ‘EPBMode’}; % Replace with your desired signals
for k = 1:numel(desiredChannelGroups)
channelGroup = desiredChannelGroups{k};
if isfield(data, channelGroup)
for l = 1:numel(desiredSignals)
signal = desiredSignals{l};
if isfield(data.(channelGroup), signal)
if isfield(combinedData, [channelGroup ‘.’ signal])
combinedData.([channelGroup ‘.’ signal]) = [combinedData.([channelGroup ‘.’ signal]), data.(channelGroup).(signal)];
else
combinedData.([channelGroup ‘.’ signal]) = data.(channelGroup).(signal);
end
end
end
end
end
end
end
% Create a timetable from the combined data structure
timeField = ‘Time_10Hz’; % Assuming ‘Time’ is the field containing time information
combinedTimetable = timetable(combinedData.(timeField), combinedData);
% Save the combined data to a new MDF file
[fileName, folderPath] = uiputfile(‘*.mdf’, ‘Save Combined MDF File’);
if fileName ~= 0 % Check if a file name is provided
outputFilePath = fullfile(folderPath, fileName);
mdfWrite(outputFilePath, combinedTimetable);
msgbox(‘MDF files combined successfully!’, ‘Success’);
end
endI am trying unzip a collection of mdf4 files, combine them into 1 mdf4 file and save it. I am getting the following error (attached):
‘Time_10Hz’ does exist in the dataset as shown (attached)
Any help would be appreciated! Code is attached below
% Open file selection dialog to choose MDF files
[fileNames, folderPath] = uigetfile(‘*.mdf;*.zip’, ‘Select MDF or ZIP files’, ‘MultiSelect’, ‘on’);
if ~ischar(fileNames) % Check if any file is selected
combinedData = struct(); % Initialize an empty structure to store combined data
for i = 1:numel(fileNames)
filePath = fullfile(folderPath, fileNames{i});
% Check if the file is a ZIP archive
if endsWith(filePath, ‘.zip’)
% Unzip the archive to a temporary folder
tempFolder = tempname;
unzip(filePath, tempFolder);
% Find the MDF file(s) in the temporary folder
mdfFiles = dir(fullfile(tempFolder, ‘*.mdf’));
for j = 1:numel(mdfFiles)
mdfFilePath = fullfile(tempFolder, mdfFiles(j).name);
data = mdfimport(mdfFilePath);
% Extract desired channel groups and signals
desiredChannelGroups = {’32’}; % Replace with your desired channel groups
desiredSignals = {‘YawRate’, ‘EPBMode’}; % Replace with your desired signals
for k = 1:numel(desiredChannelGroups)
channelGroup = desiredChannelGroups{k};
if isfield(data, channelGroup)
for l = 1:numel(desiredSignals)
signal = desiredSignals{l};
if isfield(data.(channelGroup), signal)
if isfield(combinedData, [channelGroup ‘.’ signal])
combinedData.([channelGroup ‘.’ signal]) = [combinedData.([channelGroup ‘.’ signal]), data.(channelGroup).(signal)];
else
combinedData.([channelGroup ‘.’ signal]) = data.(channelGroup).(signal);
end
end
end
end
end
end
% Clean up the temporary folder
rmdir(tempFolder, ‘s’);
else
% Import the MDF file directly
data = mdfimport(filePath);
% Extract desired channel groups and signals
desiredChannelGroups = {’32’}; % Replace with your desired channel groups
desiredSignals = {‘YawRate’, ‘EPBMode’}; % Replace with your desired signals
for k = 1:numel(desiredChannelGroups)
channelGroup = desiredChannelGroups{k};
if isfield(data, channelGroup)
for l = 1:numel(desiredSignals)
signal = desiredSignals{l};
if isfield(data.(channelGroup), signal)
if isfield(combinedData, [channelGroup ‘.’ signal])
combinedData.([channelGroup ‘.’ signal]) = [combinedData.([channelGroup ‘.’ signal]), data.(channelGroup).(signal)];
else
combinedData.([channelGroup ‘.’ signal]) = data.(channelGroup).(signal);
end
end
end
end
end
end
end
% Create a timetable from the combined data structure
timeField = ‘Time_10Hz’; % Assuming ‘Time’ is the field containing time information
combinedTimetable = timetable(combinedData.(timeField), combinedData);
% Save the combined data to a new MDF file
[fileName, folderPath] = uiputfile(‘*.mdf’, ‘Save Combined MDF File’);
if fileName ~= 0 % Check if a file name is provided
outputFilePath = fullfile(folderPath, fileName);
mdfWrite(outputFilePath, combinedTimetable);
msgbox(‘MDF files combined successfully!’, ‘Success’);
end
end I am trying unzip a collection of mdf4 files, combine them into 1 mdf4 file and save it. I am getting the following error (attached):
‘Time_10Hz’ does exist in the dataset as shown (attached)
Any help would be appreciated! Code is attached below
% Open file selection dialog to choose MDF files
[fileNames, folderPath] = uigetfile(‘*.mdf;*.zip’, ‘Select MDF or ZIP files’, ‘MultiSelect’, ‘on’);
if ~ischar(fileNames) % Check if any file is selected
combinedData = struct(); % Initialize an empty structure to store combined data
for i = 1:numel(fileNames)
filePath = fullfile(folderPath, fileNames{i});
% Check if the file is a ZIP archive
if endsWith(filePath, ‘.zip’)
% Unzip the archive to a temporary folder
tempFolder = tempname;
unzip(filePath, tempFolder);
% Find the MDF file(s) in the temporary folder
mdfFiles = dir(fullfile(tempFolder, ‘*.mdf’));
for j = 1:numel(mdfFiles)
mdfFilePath = fullfile(tempFolder, mdfFiles(j).name);
data = mdfimport(mdfFilePath);
% Extract desired channel groups and signals
desiredChannelGroups = {’32’}; % Replace with your desired channel groups
desiredSignals = {‘YawRate’, ‘EPBMode’}; % Replace with your desired signals
for k = 1:numel(desiredChannelGroups)
channelGroup = desiredChannelGroups{k};
if isfield(data, channelGroup)
for l = 1:numel(desiredSignals)
signal = desiredSignals{l};
if isfield(data.(channelGroup), signal)
if isfield(combinedData, [channelGroup ‘.’ signal])
combinedData.([channelGroup ‘.’ signal]) = [combinedData.([channelGroup ‘.’ signal]), data.(channelGroup).(signal)];
else
combinedData.([channelGroup ‘.’ signal]) = data.(channelGroup).(signal);
end
end
end
end
end
end
% Clean up the temporary folder
rmdir(tempFolder, ‘s’);
else
% Import the MDF file directly
data = mdfimport(filePath);
% Extract desired channel groups and signals
desiredChannelGroups = {’32’}; % Replace with your desired channel groups
desiredSignals = {‘YawRate’, ‘EPBMode’}; % Replace with your desired signals
for k = 1:numel(desiredChannelGroups)
channelGroup = desiredChannelGroups{k};
if isfield(data, channelGroup)
for l = 1:numel(desiredSignals)
signal = desiredSignals{l};
if isfield(data.(channelGroup), signal)
if isfield(combinedData, [channelGroup ‘.’ signal])
combinedData.([channelGroup ‘.’ signal]) = [combinedData.([channelGroup ‘.’ signal]), data.(channelGroup).(signal)];
else
combinedData.([channelGroup ‘.’ signal]) = data.(channelGroup).(signal);
end
end
end
end
end
end
end
% Create a timetable from the combined data structure
timeField = ‘Time_10Hz’; % Assuming ‘Time’ is the field containing time information
combinedTimetable = timetable(combinedData.(timeField), combinedData);
% Save the combined data to a new MDF file
[fileName, folderPath] = uiputfile(‘*.mdf’, ‘Save Combined MDF File’);
if fileName ~= 0 % Check if a file name is provided
outputFilePath = fullfile(folderPath, fileName);
mdfWrite(outputFilePath, combinedTimetable);
msgbox(‘MDF files combined successfully!’, ‘Success’);
end
end mdf4, matlab, import, mdfimport MATLAB Answers — New Questions
parse error and Directory error for class definition
hey guys, in the below code, i am having 2 errors:
I cannot run the code due to this error: "A class definition must be in an "@" directory",
there is a "parse error usage might be invalid matlab syntax" at line "inputData"
the working folder in this case is : C:UsersautoCar@PCTemplates@preprocessor
inside templates folder I have also other working .m scripts, but without any class definitions.
matlab verison R2015b
How to solve this issues?
Thankyou!
classdef preprocessor
properties
vehicleParameters
weatherConditions
roadDefinitions
maneuvers
faultInjections
end
methods
function obj = preprocessor(vehicleParams, weatherConds, roadDefs, maneuvers, faults)
if nargin > 0
obj.vehicleParameters = vehicleParams;
obj.weatherConditions = weatherConds;
obj.roadDefinitions = roadDefs;
obj.maneuvers = maneuvers;
obj.faultInjections = faults;
end
end
end
end
%% %% Define the structure containing all parameters and values
inputData = struct();hey guys, in the below code, i am having 2 errors:
I cannot run the code due to this error: "A class definition must be in an "@" directory",
there is a "parse error usage might be invalid matlab syntax" at line "inputData"
the working folder in this case is : C:UsersautoCar@PCTemplates@preprocessor
inside templates folder I have also other working .m scripts, but without any class definitions.
matlab verison R2015b
How to solve this issues?
Thankyou!
classdef preprocessor
properties
vehicleParameters
weatherConditions
roadDefinitions
maneuvers
faultInjections
end
methods
function obj = preprocessor(vehicleParams, weatherConds, roadDefs, maneuvers, faults)
if nargin > 0
obj.vehicleParameters = vehicleParams;
obj.weatherConditions = weatherConds;
obj.roadDefinitions = roadDefs;
obj.maneuvers = maneuvers;
obj.faultInjections = faults;
end
end
end
end
%% %% Define the structure containing all parameters and values
inputData = struct(); hey guys, in the below code, i am having 2 errors:
I cannot run the code due to this error: "A class definition must be in an "@" directory",
there is a "parse error usage might be invalid matlab syntax" at line "inputData"
the working folder in this case is : C:UsersautoCar@PCTemplates@preprocessor
inside templates folder I have also other working .m scripts, but without any class definitions.
matlab verison R2015b
How to solve this issues?
Thankyou!
classdef preprocessor
properties
vehicleParameters
weatherConditions
roadDefinitions
maneuvers
faultInjections
end
methods
function obj = preprocessor(vehicleParams, weatherConds, roadDefs, maneuvers, faults)
if nargin > 0
obj.vehicleParameters = vehicleParams;
obj.weatherConditions = weatherConds;
obj.roadDefinitions = roadDefs;
obj.maneuvers = maneuvers;
obj.faultInjections = faults;
end
end
end
end
%% %% Define the structure containing all parameters and values
inputData = struct(); matlab, oop, student, class MATLAB Answers — New Questions
plot normal distribution plot on histogram of residuals
Does anyone know how to do that?
Would be great if it could look like that:
<</matlabcentral/answers/uploaded_files/15773/heavy_tailed_plot.gif>>
Thank you!!!Does anyone know how to do that?
Would be great if it could look like that:
<</matlabcentral/answers/uploaded_files/15773/heavy_tailed_plot.gif>>
Thank you!!! Does anyone know how to do that?
Would be great if it could look like that:
<</matlabcentral/answers/uploaded_files/15773/heavy_tailed_plot.gif>>
Thank you!!! histogram of residuals, normal probability MATLAB Answers — New Questions
Entra ID licencing accross tenants
Hi,
A question that we have not been able to fully grasp, hoping for some guidance.
If all users in a main tenant (ad.company1.com) are assigned office (cloud) licenses with Entra Id P2 licences.
The company is currently operating four different Microsoft Entra ID instances, using four different identities and users are synched between these four tenants.
They are using services in all these environments that require Entra ID P2 licenses (e.g: conditional access), both for configuring and for consuming the service. Note that the P2 license needs to be assigned to at least one user in the directory to be able to configure the services. Consumption should require a license per user, but this is not technically enforced. Users are able to consume regardless of license assignment.
Would they actually need multiple Entra ID P2 lics per user (one per tenant?) to be properly licensed (compliant), even though every physical person carries one P2 license in the main tenant?
Hi, A question that we have not been able to fully grasp, hoping for some guidance. If all users in a main tenant (ad.company1.com) are assigned office (cloud) licenses with Entra Id P2 licences. The company is currently operating four different Microsoft Entra ID instances, using four different identities and users are synched between these four tenants. They are using services in all these environments that require Entra ID P2 licenses (e.g: conditional access), both for configuring and for consuming the service. Note that the P2 license needs to be assigned to at least one user in the directory to be able to configure the services. Consumption should require a license per user, but this is not technically enforced. Users are able to consume regardless of license assignment. Would they actually need multiple Entra ID P2 lics per user (one per tenant?) to be properly licensed (compliant), even though every physical person carries one P2 license in the main tenant? Read More

Cannot create email groups in exchange admin center
Hello
Please i need your help on this issue.
Cannot create email groups in exchange admin center
When I attempt to create and email group using EAC I get the following error.
We couldn’t create the group.
Exception of type ‘Microsoft.Online.BOX.Util.Exceptions.InternalException’ was thrown.
Hello Please i need your help on this issue. Cannot create email groups in exchange admin center When I attempt to create and email group using EAC I get the following error. We couldn’t create the group.Exception of type ‘Microsoft.Online.BOX.Util.Exceptions.InternalException’ was thrown. Read More
What front end for Sq; Server
I am converting a MS Access tables and queries to Sql Server back end. The app is a personal finance app. When completed the back end will be cloud based. Then, I will convert the MS Access front end to cross platform(windows, Mac, Google and Linux with compatibility with Android and IOS. I don’t know what language to use for this front end. I am a self taught developer and I know that I am not the best or fastest and would have to learn the language. What language would you recommend and why?
I am converting a MS Access tables and queries to Sql Server back end. The app is a personal finance app. When completed the back end will be cloud based. Then, I will convert the MS Access front end to cross platform(windows, Mac, Google and Linux with compatibility with Android and IOS. I don’t know what language to use for this front end. I am a self taught developer and I know that I am not the best or fastest and would have to learn the language. What language would you recommend and why? Read More
New Outlook: Send To OneNote Is Not Missing. It’s buried.
Do you rely heavily on OneNote to keep your life organized? Are you unable to find the Send to OneNote icon in New Outlook?
The Send to OneNote icon is buried deep down in the customize action ribbon – don’t worry, I’ve got a video that will show you how to resurrect it!
Video: https://youtu.be/aZYpAmMDnM4?si=2Yi8-mMigRZXEBu9
If you found this information helpful, please mark it as the best response.
/Teresa #traccreations4e 04/24/2024
Do you rely heavily on OneNote to keep your life organized? Are you unable to find the Send to OneNote icon in New Outlook?
The Send to OneNote icon is buried deep down in the customize action ribbon – don’t worry, I’ve got a video that will show you how to resurrect it! Video: https://youtu.be/aZYpAmMDnM4?si=2Yi8-mMigRZXEBu9
If you found this information helpful, please mark it as the best response.
/Teresa #traccreations4e 04/24/2024 Read More
Word shuts down
I went to use my Microsoft® Word for Microsoft 365 MSO (Version 2403 Build 16.0.17425.20176) 64-bit and when I start to type anything it shut down. I am then asked if I want to use it in safe mode, but that shuts down as well. It was working fine on Monday and when I went in to use it yesterday after Windows did an update Monday night , this is what is happening.
I went to use my Microsoft® Word for Microsoft 365 MSO (Version 2403 Build 16.0.17425.20176) 64-bit and when I start to type anything it shut down. I am then asked if I want to use it in safe mode, but that shuts down as well. It was working fine on Monday and when I went in to use it yesterday after Windows did an update Monday night , this is what is happening. Read More
Join our Holistic Listening session at the Microsoft 365 Community Conference
I’m excited to attend the Microsoft 365 Community Conference next week, April 30 – May 2, in Orlando, Florida with Quentin Mackey, Global Product Manager of Viva Glint, delivering a session on Holistic Listening using Viva Glint, Viva Insights, and Viva Pulse. This session will help attendees understand how to seek and act on the many signals available in the employee experience to help people feel engaged, productive, and perform at their best. We’ll be sharing best practices, showcasing new technology, and highlighting a customer case study.
There is also a track dedicated to HR professionals, communicators, and business stakeholders in employee experience empowering attendees to:
Engage employees: Inspire employees to spark participation, contribution, and action toward cultural and business objectives. Accelerate innovation and drive a high-performance organization that is inclusive of everyone from the executive suite to the frontline.
Modernize internal communications: Evolve strategies to achieve communications objectives with engaging content that reaches audiences where they work, while reducing noise & interruption. Leverage advanced analytics and AI to measure and improve effectiveness.
You can learn more here about this conference track.
Join us in person with over 175 Microsoft and community experts in one place by registering here. Note: use the MSCMTY discount code to save $100 USD.
Do you want to learn more about the conference and more reasons to attend? Check out this blog to learn more about the conference.
The Microsoft 365 Community Conference returns to Orlando, FL, April 30 – May 2, 2024 – with two pre-event and one post-event workshop days. It’s a wonderful event dedicated to Copilot and AI, SharePoint, Teams, OneDrive, Viva, Power Platform, and related Microsoft 365 apps and services. Plus, a full Transformation track for communicators, HR, and business stakeholders in workplace experience.
Microsoft Tech Community – Latest Blogs –Read More
Unlocking the Power of Azure Integration Services: A Webinar You Can’t Miss!
In today’s rapidly evolving tech landscape, seamless integration stands as the cornerstone of innovation and growth. As a technology decision-maker, you understand the pivotal role integrations play in driving success across industries.
Join us for an enlightening 90-minute webinar, where you’ll uncover how Azure Integration Services can empower your organization to navigate integration complexities with ease and efficiency. Gain actionable insights and practical guidance directly from Azure Integration Services product leaders, as well as insights from our customers and partners.
Here’s a glimpse of what to expect:
Drive Revenue Growth with Business Process Automation: Dive into how Azure Logic Apps can streamline operations, boost efficiency, and ultimately drive revenue growth by automating repetitive tasks and fostering seamless collaboration.
Empower Every Team with Universal API Discovery and Access: Explore how Azure API Center empowers teams throughout your organization, granting easy access to a wide array of APIs, thereby fostering collaboration and accelerating innovation.
Fortify Security and Compliance Posture with Comprehensive API Security Strategies: Learn firsthand how Azure API Management offers robust security measures, shielding your organization from cyber threats while ensuring compliance with industry regulations, thus safeguarding both your data and reputation.
Unleash Innovation with AI’s Potential for Integration: Discover the transformative power of AI-driven integration and how Azure Integration Services can assist in harnessing AI capabilities to automate tasks, unlock new opportunities, and drive innovation.
Join us for this live event to ask your questions and receive expert guidance on how integration can maximize your investments and accelerate your app innovation programs.
Don’t miss out on this exclusive opportunity to gain invaluable insights, engage with industry experts, and elevate your organization’s integration strategy. Register now to secure your spot and empower your organization with Azure Integration Services!
Microsoft Tech Community – Latest Blogs –Read More
Unable to clear editField more than once
I am creating a typing test on the MatLab AppDesigner. I have simplified it down to a core problem. I have placed an EditField on the screen and have created this code for the function EditFieldValueChanging(app,event):
currentText = event.Value;
if contains(currentText,’test’)
app.EditField.Value = ‘ ‘;
disp(‘good job’)
end
I have two issues: firstly, I cannot set the app.EditField.Value to nothing (i.e. ”). I tried this with a TextArea and it did work however, so I have found a workaround. Secondly and the main issue, is that once it clears the text, it only works once. If I type ‘hello’ again into the text box, it displays ‘good job’ but does not clear the text the second time around. I really appreciate any help.I am creating a typing test on the MatLab AppDesigner. I have simplified it down to a core problem. I have placed an EditField on the screen and have created this code for the function EditFieldValueChanging(app,event):
currentText = event.Value;
if contains(currentText,’test’)
app.EditField.Value = ‘ ‘;
disp(‘good job’)
end
I have two issues: firstly, I cannot set the app.EditField.Value to nothing (i.e. ”). I tried this with a TextArea and it did work however, so I have found a workaround. Secondly and the main issue, is that once it clears the text, it only works once. If I type ‘hello’ again into the text box, it displays ‘good job’ but does not clear the text the second time around. I really appreciate any help. I am creating a typing test on the MatLab AppDesigner. I have simplified it down to a core problem. I have placed an EditField on the screen and have created this code for the function EditFieldValueChanging(app,event):
currentText = event.Value;
if contains(currentText,’test’)
app.EditField.Value = ‘ ‘;
disp(‘good job’)
end
I have two issues: firstly, I cannot set the app.EditField.Value to nothing (i.e. ”). I tried this with a TextArea and it did work however, so I have found a workaround. Secondly and the main issue, is that once it clears the text, it only works once. If I type ‘hello’ again into the text box, it displays ‘good job’ but does not clear the text the second time around. I really appreciate any help. appdesigner, app designer, text, input MATLAB Answers — New Questions
How to manually remove the unwanted data dots or lines in a graph?
I want to know if a function exists to manually remove the dots in an image like this. In this image, the unwanted dots are in the red circle. I hope I can use something like a brush to remove them and let them become the black background. Any suggestion is appreciated!I want to know if a function exists to manually remove the dots in an image like this. In this image, the unwanted dots are in the red circle. I hope I can use something like a brush to remove them and let them become the black background. Any suggestion is appreciated! I want to know if a function exists to manually remove the dots in an image like this. In this image, the unwanted dots are in the red circle. I hope I can use something like a brush to remove them and let them become the black background. Any suggestion is appreciated! image processing MATLAB Answers — New Questions
Create a solid line instead of single points in the plot
My Problem is I calculated curves out of 81 Data points and want to plot it as a solid line. If I plot it, the only way it shows the curve is as points, stars etc. As you can see in the picture below.
I have to do this seven times.
The code for this is:
imax is from 1 to 7 an (each curve)
N is from 1 to 81 and are my data points
The rest is calculated before but not relevant for the problem
vR=ones(imax,N);
FZA2=ones(imax,N);
vR(k,h)=(2*pi*rdyn)*(nR(k,h)/60)*3.6;
FZA2(k,h)=(T2(h,1)*i2(k)*i2E*nges)/rdyn; %in N
plot(vR(1,h),FZA2(1,h),’.b’,vR(2,h),FZA2(2,h),’.r’,vR(3,h),FZA2(3,h),’.g’,vR(4,h),FZA2(4,h),’.c’,vR(5,h),FZA2(5,h),’.y’,vR(6,h),FZA2(6,h),’.m’,vR(7,h),FZA2(7,h),’.b’);My Problem is I calculated curves out of 81 Data points and want to plot it as a solid line. If I plot it, the only way it shows the curve is as points, stars etc. As you can see in the picture below.
I have to do this seven times.
The code for this is:
imax is from 1 to 7 an (each curve)
N is from 1 to 81 and are my data points
The rest is calculated before but not relevant for the problem
vR=ones(imax,N);
FZA2=ones(imax,N);
vR(k,h)=(2*pi*rdyn)*(nR(k,h)/60)*3.6;
FZA2(k,h)=(T2(h,1)*i2(k)*i2E*nges)/rdyn; %in N
plot(vR(1,h),FZA2(1,h),’.b’,vR(2,h),FZA2(2,h),’.r’,vR(3,h),FZA2(3,h),’.g’,vR(4,h),FZA2(4,h),’.c’,vR(5,h),FZA2(5,h),’.y’,vR(6,h),FZA2(6,h),’.m’,vR(7,h),FZA2(7,h),’.b’); My Problem is I calculated curves out of 81 Data points and want to plot it as a solid line. If I plot it, the only way it shows the curve is as points, stars etc. As you can see in the picture below.
I have to do this seven times.
The code for this is:
imax is from 1 to 7 an (each curve)
N is from 1 to 81 and are my data points
The rest is calculated before but not relevant for the problem
vR=ones(imax,N);
FZA2=ones(imax,N);
vR(k,h)=(2*pi*rdyn)*(nR(k,h)/60)*3.6;
FZA2(k,h)=(T2(h,1)*i2(k)*i2E*nges)/rdyn; %in N
plot(vR(1,h),FZA2(1,h),’.b’,vR(2,h),FZA2(2,h),’.r’,vR(3,h),FZA2(3,h),’.g’,vR(4,h),FZA2(4,h),’.c’,vR(5,h),FZA2(5,h),’.y’,vR(6,h),FZA2(6,h),’.m’,vR(7,h),FZA2(7,h),’.b’); plot, solid line, data points MATLAB Answers — New Questions
Help GUI Layout toolbox Relative widths
I am writing an interface with GUI Layout toolbox, which has two rows and three columns of block diagrams. I found that the "widths" function can only set the absolute width, and when the display size changes, the layout of block diagrams will also change, which is very ugly, so I would like to ask if you can set the relative proportion of block diagrams? This allows the application to display the same effect on different screen sizes.
Part of my code is as follows:
g = uix.Grid( ‘Parent’, p1, ‘Spacing’, 1 ,’Padding’,1,’BackgroundColor’,[0.8 0.9 0.5]);
g1 = uix.Panel( ‘Parent’,g, ‘Title’, ”, ‘Padding’, 0 ,’FontWeight’,’bold’,’fontsize’,12,’TitlePosition’, ‘centertop’);
g2 = uix.Panel( ‘Parent’,g, ‘Title’, ”, ‘Padding’, 0 ,’FontWeight’,’bold’,’fontsize’,12,’TitlePosition’, ‘centertop’);
obj.ax(5) = axes( ‘Parent’,uicontainer(‘Parent’, g1));%,’Clipping’,’on’,’ActivePositionProperty’, ‘OuterPosition’);
obj.ax(6) = axes( ‘Parent’,uicontainer(‘Parent’, g2));%,’Clipping’,’on’,’ActivePositionProperty’, ‘OuterPosition’);
set( g, ‘Widths’, [-1 400 -2.5], ‘Heights’, [-1 -1] );I am writing an interface with GUI Layout toolbox, which has two rows and three columns of block diagrams. I found that the "widths" function can only set the absolute width, and when the display size changes, the layout of block diagrams will also change, which is very ugly, so I would like to ask if you can set the relative proportion of block diagrams? This allows the application to display the same effect on different screen sizes.
Part of my code is as follows:
g = uix.Grid( ‘Parent’, p1, ‘Spacing’, 1 ,’Padding’,1,’BackgroundColor’,[0.8 0.9 0.5]);
g1 = uix.Panel( ‘Parent’,g, ‘Title’, ”, ‘Padding’, 0 ,’FontWeight’,’bold’,’fontsize’,12,’TitlePosition’, ‘centertop’);
g2 = uix.Panel( ‘Parent’,g, ‘Title’, ”, ‘Padding’, 0 ,’FontWeight’,’bold’,’fontsize’,12,’TitlePosition’, ‘centertop’);
obj.ax(5) = axes( ‘Parent’,uicontainer(‘Parent’, g1));%,’Clipping’,’on’,’ActivePositionProperty’, ‘OuterPosition’);
obj.ax(6) = axes( ‘Parent’,uicontainer(‘Parent’, g2));%,’Clipping’,’on’,’ActivePositionProperty’, ‘OuterPosition’);
set( g, ‘Widths’, [-1 400 -2.5], ‘Heights’, [-1 -1] ); I am writing an interface with GUI Layout toolbox, which has two rows and three columns of block diagrams. I found that the "widths" function can only set the absolute width, and when the display size changes, the layout of block diagrams will also change, which is very ugly, so I would like to ask if you can set the relative proportion of block diagrams? This allows the application to display the same effect on different screen sizes.
Part of my code is as follows:
g = uix.Grid( ‘Parent’, p1, ‘Spacing’, 1 ,’Padding’,1,’BackgroundColor’,[0.8 0.9 0.5]);
g1 = uix.Panel( ‘Parent’,g, ‘Title’, ”, ‘Padding’, 0 ,’FontWeight’,’bold’,’fontsize’,12,’TitlePosition’, ‘centertop’);
g2 = uix.Panel( ‘Parent’,g, ‘Title’, ”, ‘Padding’, 0 ,’FontWeight’,’bold’,’fontsize’,12,’TitlePosition’, ‘centertop’);
obj.ax(5) = axes( ‘Parent’,uicontainer(‘Parent’, g1));%,’Clipping’,’on’,’ActivePositionProperty’, ‘OuterPosition’);
obj.ax(6) = axes( ‘Parent’,uicontainer(‘Parent’, g2));%,’Clipping’,’on’,’ActivePositionProperty’, ‘OuterPosition’);
set( g, ‘Widths’, [-1 400 -2.5], ‘Heights’, [-1 -1] ); gui layout tool, withds MATLAB Answers — New Questions
Teams with multiple channels how to set different rights
hey,
I use a Team
It should have 2 channels inside
01-admin
02-users
I know that the users in the team access is also given the channels.
but when 01-admin should has other access rights than
02-users
whats the best practise?
add both channels as private channel?
It’s not practical to create 2 teams of your own with only one channel each?
thanks for supporting me 🙂
hey,I use a TeamIt should have 2 channels inside01-admin02-usersI know that the users in the team access is also given the channels. but when 01-admin should has other access rights than02-users whats the best practise?add both channels as private channel?It’s not practical to create 2 teams of your own with only one channel each?thanks for supporting me 🙂 Read More
Problems with PDF printing in Edge
Good morning.
Recently we had reports of users having problems when printing PDF, where it was not adjusting the printing area automatically. To resolve the problem manually, users need to click on “Actual Size” and then return to “Adjust to the print area”, this way it changes the scale correctly. Testing was carried out on older versions of Edge and this problem did not appear. Thanks in advance!
Good morning.Recently we had reports of users having problems when printing PDF, where it was not adjusting the printing area automatically. To resolve the problem manually, users need to click on “Actual Size” and then return to “Adjust to the print area”, this way it changes the scale correctly. Testing was carried out on older versions of Edge and this problem did not appear. Thanks in advance! Read More


