

Category: News
How to set desktop background from spotlight to picture option using powershell script
How to set desktop background from spotlight to picture option by setting registry key using powershell script
How to set desktop background from spotlight to picture option by setting registry key using powershell script Read More
To Do app can’t open right click menu
Hi,
After my laptop upgrade to Windows 11 , the To Do app can’t right click to move the task.
It doesn’t show on the menu.
My colleague have same problem with me.
Do you have any solution about this problem?
Thank you.
Regards,
Hao.
Hi, After my laptop upgrade to Windows 11 , the To Do app can’t right click to move the task.It doesn’t show on the menu.My colleague have same problem with me.Do you have any solution about this problem?Thank you.Is there have any setting or update should I need to do? Regards,Hao. Read More
Hello I am unable to renewal my Microsoft Certificate
Yesterday was the last day for me to renew my microsoft certificate and i was presuming that i have multiple attempts to clear the renewal test but unfortunately after two attempts it has given a message that i have to wait for 24 hours to give more attempt and i couldn’t make it…..I request Microsoft to allow me one day time so i can renew my certificate.
Yesterday was the last day for me to renew my microsoft certificate and i was presuming that i have multiple attempts to clear the renewal test but unfortunately after two attempts it has given a message that i have to wait for 24 hours to give more attempt and i couldn’t make it…..I request Microsoft to allow me one day time so i can renew my certificate. Read More

Graph formating
Hello,
Please see the attached screen shot, my question is easy. I am working on a 100% stacked column graph and the highest % is shown is the smaller block, why and how can I change that please?
Thank you for your help
Hello,Please see the attached screen shot, my question is easy. I am working on a 100% stacked column graph and the highest % is shown is the smaller block, why and how can I change that please? Thank you for your help Read More
How to display graph data by vehicle center of gravity in the Data Inspector in Simulink?
Hi I am working my way through the Vehicle Steering Gain at Different Speeds example.
In that example,
vmax = [45, 50, 55];
numExperiments = length(vmax);
to show the values from speeds 45 to 55 in the data inspector. I would like to replace the declared speed values with the vehicle’s center of gravity (VEH.FrontAxlePositionfromCG, VEH.RearAxlePositionfromCG, VEH.HeightCG) specified in parentheses and show them in the data inspector.
But I don’t know how…
In the Vehicle Steering Gain at Different Speeds example above, the command to represent the data inspector based on speed would look like the command below.
for idx = 1:numExperiments
% Create sdi run object
simoutRun(idx)=Simulink.sdi.Run.create;
simoutRun(idx).Name=[‘Velocity = ‘, num2str(vmax(idx))];
add(simoutRun(idx),’vars’,simout(idx));
end
sigcolor=[0 1 0;0 0 1;1 0 1];
for idx = 1:numExperiments
% Extract the lateral acceleration, position, and steering
msignal(idx)=getSignalsByName(simoutRun(idx), ‘xdot_mph’);
msignal(idx).LineColor =sigcolor((idx),:);
ssignal(idx)=getSignalsByName(simoutRun(idx), ‘SteerAngle’);
ssignal(idx).LineColor =sigcolor((idx),:);
asignal(idx)=getSignalsByName(simoutRun(idx), ‘Lateral acceleration’);
asignal(idx).LineColor =sigcolor((idx),:);
xsignal(idx)=getSignalsByName(simoutRun(idx), ‘Passenger Vehicle:1.Body.InertFrm.Cg.Disp.X’);
xsignal(idx).LineColor =sigcolor((idx),:);
ysignal(idx)=getSignalsByName(simoutRun(idx), ‘Passenger Vehicle:1.Body.InertFrm.Cg.Disp.Y’);
ysignal(idx).LineColor =sigcolor((idx),:);
end
Simulink.sdi.view
Simulink.sdi.setSubPlotLayout(5,1);
for idx = 1:numExperiments
% Plot the lateral position, steering angle, and lateral acceleration
plotOnSubPlot(msignal(idx),1,1,true);
plotOnSubPlot(ssignal(idx),2,1,true);
plotOnSubPlot(asignal(idx),3,1,true);
plotOnSubPlot(xsignal(idx),4,1,true);
plotOnSubPlot(ysignal(idx),5,1,true);
end
Translated with www.DeepL.com/Translator (free version)Hi I am working my way through the Vehicle Steering Gain at Different Speeds example.
In that example,
vmax = [45, 50, 55];
numExperiments = length(vmax);
to show the values from speeds 45 to 55 in the data inspector. I would like to replace the declared speed values with the vehicle’s center of gravity (VEH.FrontAxlePositionfromCG, VEH.RearAxlePositionfromCG, VEH.HeightCG) specified in parentheses and show them in the data inspector.
But I don’t know how…
In the Vehicle Steering Gain at Different Speeds example above, the command to represent the data inspector based on speed would look like the command below.
for idx = 1:numExperiments
% Create sdi run object
simoutRun(idx)=Simulink.sdi.Run.create;
simoutRun(idx).Name=[‘Velocity = ‘, num2str(vmax(idx))];
add(simoutRun(idx),’vars’,simout(idx));
end
sigcolor=[0 1 0;0 0 1;1 0 1];
for idx = 1:numExperiments
% Extract the lateral acceleration, position, and steering
msignal(idx)=getSignalsByName(simoutRun(idx), ‘xdot_mph’);
msignal(idx).LineColor =sigcolor((idx),:);
ssignal(idx)=getSignalsByName(simoutRun(idx), ‘SteerAngle’);
ssignal(idx).LineColor =sigcolor((idx),:);
asignal(idx)=getSignalsByName(simoutRun(idx), ‘Lateral acceleration’);
asignal(idx).LineColor =sigcolor((idx),:);
xsignal(idx)=getSignalsByName(simoutRun(idx), ‘Passenger Vehicle:1.Body.InertFrm.Cg.Disp.X’);
xsignal(idx).LineColor =sigcolor((idx),:);
ysignal(idx)=getSignalsByName(simoutRun(idx), ‘Passenger Vehicle:1.Body.InertFrm.Cg.Disp.Y’);
ysignal(idx).LineColor =sigcolor((idx),:);
end
Simulink.sdi.view
Simulink.sdi.setSubPlotLayout(5,1);
for idx = 1:numExperiments
% Plot the lateral position, steering angle, and lateral acceleration
plotOnSubPlot(msignal(idx),1,1,true);
plotOnSubPlot(ssignal(idx),2,1,true);
plotOnSubPlot(asignal(idx),3,1,true);
plotOnSubPlot(xsignal(idx),4,1,true);
plotOnSubPlot(ysignal(idx),5,1,true);
end
Translated with www.DeepL.com/Translator (free version) Hi I am working my way through the Vehicle Steering Gain at Different Speeds example.
In that example,
vmax = [45, 50, 55];
numExperiments = length(vmax);
to show the values from speeds 45 to 55 in the data inspector. I would like to replace the declared speed values with the vehicle’s center of gravity (VEH.FrontAxlePositionfromCG, VEH.RearAxlePositionfromCG, VEH.HeightCG) specified in parentheses and show them in the data inspector.
But I don’t know how…
In the Vehicle Steering Gain at Different Speeds example above, the command to represent the data inspector based on speed would look like the command below.
for idx = 1:numExperiments
% Create sdi run object
simoutRun(idx)=Simulink.sdi.Run.create;
simoutRun(idx).Name=[‘Velocity = ‘, num2str(vmax(idx))];
add(simoutRun(idx),’vars’,simout(idx));
end
sigcolor=[0 1 0;0 0 1;1 0 1];
for idx = 1:numExperiments
% Extract the lateral acceleration, position, and steering
msignal(idx)=getSignalsByName(simoutRun(idx), ‘xdot_mph’);
msignal(idx).LineColor =sigcolor((idx),:);
ssignal(idx)=getSignalsByName(simoutRun(idx), ‘SteerAngle’);
ssignal(idx).LineColor =sigcolor((idx),:);
asignal(idx)=getSignalsByName(simoutRun(idx), ‘Lateral acceleration’);
asignal(idx).LineColor =sigcolor((idx),:);
xsignal(idx)=getSignalsByName(simoutRun(idx), ‘Passenger Vehicle:1.Body.InertFrm.Cg.Disp.X’);
xsignal(idx).LineColor =sigcolor((idx),:);
ysignal(idx)=getSignalsByName(simoutRun(idx), ‘Passenger Vehicle:1.Body.InertFrm.Cg.Disp.Y’);
ysignal(idx).LineColor =sigcolor((idx),:);
end
Simulink.sdi.view
Simulink.sdi.setSubPlotLayout(5,1);
for idx = 1:numExperiments
% Plot the lateral position, steering angle, and lateral acceleration
plotOnSubPlot(msignal(idx),1,1,true);
plotOnSubPlot(ssignal(idx),2,1,true);
plotOnSubPlot(asignal(idx),3,1,true);
plotOnSubPlot(xsignal(idx),4,1,true);
plotOnSubPlot(ysignal(idx),5,1,true);
end
Translated with www.DeepL.com/Translator (free version) vehicle steering gain at different speeds, simulink MATLAB Answers — New Questions

asking for help to solve my problem with optimization
At first, an optimization option appeared in “Review -> Workbook Performance”. After optimizing, it removed all the empty rows below. I also can’t insert rows using “Home -> Insert Sheet Rows”.
Fingers crossed that you can lend me a hand. Thank you beforehand !
At first, an optimization option appeared in “Review -> Workbook Performance”. After optimizing, it removed all the empty rows below. I also can’t insert rows using “Home -> Insert Sheet Rows”. Fingers crossed that you can lend me a hand. Thank you beforehand ! Read More
Copy Tab in worksheet to new worksheet
I have copied a tab from one worksheet to another and when I update the Tab from the first worksheet it doesn’t automatically update in the second worksheet in which I’ve copied that tab to. What am I doing wrong? We are making sure that the tabs are updated through the Excel Desktop app and not through the website link
I have copied a tab from one worksheet to another and when I update the Tab from the first worksheet it doesn’t automatically update in the second worksheet in which I’ve copied that tab to. What am I doing wrong? We are making sure that the tabs are updated through the Excel Desktop app and not through the website link Read More
Checking the value at a specific point in time with display in Simulink
i ‘d like to check the value in time u = 133
please helpi ‘d like to check the value in time u = 133
please help i ‘d like to check the value in time u = 133
please help simulink, clock, time, display MATLAB Answers — New Questions
TI C2000 Support Package: SPI Master Transfer block
I am not able to find "SPI Master Transfer", "SPI Transmit", and "SPI Receive" with slave select.I am not able to find "SPI Master Transfer", "SPI Transmit", and "SPI Receive" with slave select. I am not able to find "SPI Master Transfer", "SPI Transmit", and "SPI Receive" with slave select. spi, c2000, f28379d MATLAB Answers — New Questions
LEARN PYTHON PROGRAMMING WITH VS CODE!
LEARN PYTHON PROGRAMMING USING VS CODE MICROSOFT LEARN STUDENT AMBASSADORS ONLINE EVENT!:graduation_cap::laptop_computer::globe_showing_americas:
My name is MAH E UROOJ and I’m Muslim Pakistani. I’m newly selected Microsoft Learn Student Ambassador milestone – Alpha. I cordially invite you all to attend a live MS Teams session scheduled this coming Friday. Your all presence will make this event a success. You will learn Fundamental Python concepts with Practical hands-on practice on Microsoft VS Code IDE. You can also get a chance to win LinkedIn Premium vouchers if event gets approved. Your all participation is needed in this regard. I hope to see you on the session day. The event joining link is given in this email.
Learn, Read, Write & Grow!
:open_book::globe_showing_americas::smiling_face_with_smiling_eyes:
Thank You!
_________
Tap on the link or paste it in a browser to join.
https://teams.microsoft.com/l/meetup-join/19%3ameeting_ODYyNzhiOTktMWZkMi00MzQ2LWI4M2YtZDMwNDMyNmQxNjg0%40thread.v2/0?context=%7b%22Tid%22%3a%2284c31ca0-ac3b-4eae-ad11-519d80233e6f%22%2c%22Oid%22%3a%22c8df4290-b528-46d5-b127-03e4618d60d3%22%7d
Join an exclusive
Live Python Fundamental Programming Session on VS Code.
:spiral_calendar:️ Day: April 26th, 2024.
:eight_o_clock: Time: 06:00 p.m. – 06:45 p.m.
:round_pushpin: Microsoft Teams Virtual Event.
Microsoft Teams Need help?
Meeting ID: 216 758 209 212
Passcode: cTkzCR
You’re invited to Learn Python Programming! :laptop_computer::graduation_cap::globe_with_meridians:
LEARN PYTHON PROGRAMMING USING VS CODE MICROSOFT LEARN STUDENT AMBASSADORS ONLINE EVENT!:graduation_cap::laptop_computer::globe_showing_americas: My name is MAH E UROOJ and I’m Muslim Pakistani. I’m newly selected Microsoft Learn Student Ambassador milestone – Alpha. I cordially invite you all to attend a live MS Teams session scheduled this coming Friday. Your all presence will make this event a success. You will learn Fundamental Python concepts with Practical hands-on practice on Microsoft VS Code IDE. You can also get a chance to win LinkedIn Premium vouchers if event gets approved. Your all participation is needed in this regard. I hope to see you on the session day. The event joining link is given in this email. Learn, Read, Write & Grow! :open_book::globe_showing_americas::smiling_face_with_smiling_eyes: Thank You!_________Tap on the link or paste it in a browser to join.https://teams.microsoft.com/l/meetup-join/19%3ameeting_ODYyNzhiOTktMWZkMi00MzQ2LWI4M2YtZDMwNDMyNmQxNjg0%40thread.v2/0?context=%7b%22Tid%22%3a%2284c31ca0-ac3b-4eae-ad11-519d80233e6f%22%2c%22Oid%22%3a%22c8df4290-b528-46d5-b127-03e4618d60d3%22%7dJoin an exclusive Live Python Fundamental Programming Session on VS Code. :spiral_calendar:️ Day: April 26th, 2024.:eight_o_clock: Time: 06:00 p.m. – 06:45 p.m. :round_pushpin: Microsoft Teams Virtual Event. Microsoft Teams Need help? Meeting ID: 216 758 209 212 Passcode: cTkzCRYou’re invited to Learn Python Programming! :laptop_computer::graduation_cap::globe_with_meridians: Read More
gradient descent for custom function
I have four equations:
1) e = m – y
2) y = W_3 * h
3) h = z + W_2 * z + f
4) f = W_1 * x
I want to update W_1, W_2 and W_3 in order to minimize a cost function J = (e^T e ) by using gradient descent.
x is an input, y is the output and m is the desired value for each sample in the dataset
I would like to do W_1 = W_1 – eta* grad(J)_w_1
W_2 = W_2 – eta* grad(J)_w_2
W_3 = W_3 – eta* grad(J)_w_3
Going through documentation I found out that you can train standard neural networks. But notice that I have some custom functions, so I guess it would be more of an optimization built in function to use.
Any ideas?I have four equations:
1) e = m – y
2) y = W_3 * h
3) h = z + W_2 * z + f
4) f = W_1 * x
I want to update W_1, W_2 and W_3 in order to minimize a cost function J = (e^T e ) by using gradient descent.
x is an input, y is the output and m is the desired value for each sample in the dataset
I would like to do W_1 = W_1 – eta* grad(J)_w_1
W_2 = W_2 – eta* grad(J)_w_2
W_3 = W_3 – eta* grad(J)_w_3
Going through documentation I found out that you can train standard neural networks. But notice that I have some custom functions, so I guess it would be more of an optimization built in function to use.
Any ideas? I have four equations:
1) e = m – y
2) y = W_3 * h
3) h = z + W_2 * z + f
4) f = W_1 * x
I want to update W_1, W_2 and W_3 in order to minimize a cost function J = (e^T e ) by using gradient descent.
x is an input, y is the output and m is the desired value for each sample in the dataset
I would like to do W_1 = W_1 – eta* grad(J)_w_1
W_2 = W_2 – eta* grad(J)_w_2
W_3 = W_3 – eta* grad(J)_w_3
Going through documentation I found out that you can train standard neural networks. But notice that I have some custom functions, so I guess it would be more of an optimization built in function to use.
Any ideas? gradient descent, neural network, optimization MATLAB Answers — New Questions
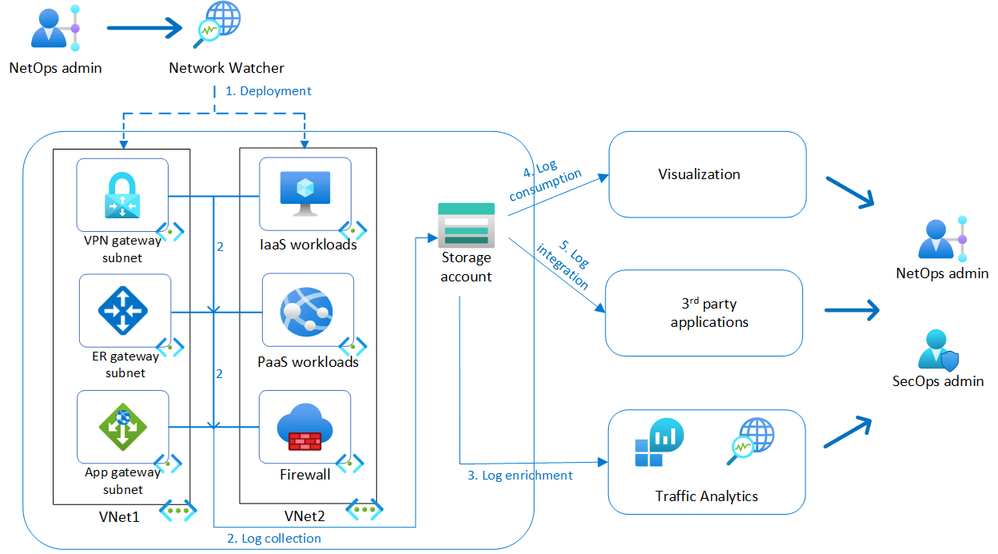
Network traffic observability with virtual network flow logs
Azure Network Watcher provides network monitoring and troubleshooting capabilities to increase observability and actionable insights with out-of-box health metrics & topology visualization, connectivity monitoring, traffic monitoring and diagnostics suite. For on-premises workloads, network administrators rely on NetFlow or IPFIX to address these use cases. Virtual network flow logs are a capability of Network Watcher service to address these scenarios for Azure and hybrid networks and we are excited to announce that virtual network flow logs are now transitioning from public preview to general availability.
Overview
Virtual network flow logs record layer-4 IP traffic flowing through a virtual network capturing the 5-tuple (source IP, destination IP, source port, destination port, protocol) and traffic volume information with no impact to application performance.
Deployment: virtual network flow logs can be enabled by NetOps admin for desired scope of virtual networks, subnets, or network interfaces.
Log collection: Inbound and outbound traffic is recorded at each network interface of the supported workloads and ingested to a storage account in JSON format for analysis and cost-effective retention.
Log enrichment: Traffic Analytics can be enabled as an add-on functionality to process the raw flow logs, aggregate them at longer intervals, and enrich them with environmental metadata for advanced insights into user and application activity and malicious communication patterns.
Log consumption: Virtual network flow logs can be accessed directly from storage accounts or integrated with out-of-box visualization such as Power BI.
Log integration: Virtual network flow logs can be integrated with 3rd party applications for network and security analysis.
Use cases of virtual network flow logs
Network security group flow logs and virtual network flow logs address the following use cases:
Network troubleshooting
Troubleshoot network connectivity between source and destination endpoints.
Identify overly restrictive or permissive access control rules.
Identify network security group (NSG) or Azure Virtual Network Manager rules blocking traffic.
Usage monitoring and optimization
Identify top talking hosts and top communicating applications across or within networks.
Monitor and visualize traffic levels and bandwidth consumption for cross-region traffic.
Identify unknown or undesired traffic.
Compliance
Record all network activity with configurable retention intervals to meet audit requirements.
Use flow data to verify network isolation and compliance with enterprise access rules.
Network forensics and security analysis
Analyze network flows from compromised IPs and network interfaces.
Identify ports and hosts communicating with public IPs or internet.
Integrate with 3rd party Intrusion Detection System (IDS) or Security Information and Event Management (SIEM) tool of choice for advanced detections and threat hunting.
Comparison to NSG flow logs
NSG flow logs also enable traffic recording but had limitations that virtual network flow logs overcome.
Capability
NSG flow logs
Virtual network flow logs
Scope of enablement
NSG
Virtual network, subnet, network interface
Identification of allowed/denied traffic in NSG rules
Yes
Yes
Identification of allowed/denied traffic by Virtual Network Manager security admin rules
No
Yes
Support of Virtual Network encryption
No
Yes
Traffic volume (bytes and packets) for stateless flows
No
Yes
Extensive resource coverage
No
Yes
Price
Billed per gigabyte of Network flow logs collected
Billed per gigabyte of Network flow logs collected
NSG flow logs can be migrated to virtual network flow logs for simplified transition to new capabilities.
Using virtual network flow logs
Virtual network flow logs can be enabled on one or more virtual networks using Azure Portal, PowerShell, AzCLI or Policy, with no requirement to attach NSGs to those virtual networks. The example below is a snippet of the flow log retrieved from storage account. Traffic flows are recorded as comma separated values with IP, port and volume information recorded under ‘flowTuples’. Traffic flows are unencrypted, as Azure virtual network encryption has not been enabled, indicated by ‘NX’.
With Traffic Analytics enabled, advanced insights on environment, traffic distribution, usage patterns, malicious flows across regions can be visualized with additional capabilities to slice and dice the data as per requirement in a Log analytics workspace with Kusto queries.
Scenarios addressed with virtual network flow logs
Demo environment
To demonstrate some of the scenarios described above, Azure environment comprising a hub and spoke topology is used, with the hub containing a Firewall, Bastion, DNS Private Resolver, and connectivity to on-premises via ExpressRoute gateway. Spoke1 has a sample application deployed on virtual machines with load balancers fronting each tier, and a private endpoint connected to an SQL Database for the DB tier. Spoke2 has sample workloads to test spoke-to-spoke traffic. Network Watcher virtual network flow logs and Traffic Analytics have been enabled on Hub and Spoke virtual networks.
Scenario 1: Troubleshooting virtual network manager security admin rules
Organizations typically have the requirement to log when network traffic is allowed or denied, to satisfy regulatory requirements and assist with troubleshooting in day-to-day operations. Network administrators can allow or deny traffic in a virtual network either using NSGs or Azure Virtual Network Manager security admin rules. Both mechanisms are logged using virtual network flow logs enabling visibility into traffic being allowed or denied.
In this case, there are both NSGs and Azure Virtual Network Manager security admin rules applied to the environment. An NSG named ‘yada-nsg’ has the second highest flow volume and an Azure Virtual Network Manager security admin rule called “nossh” is dropping SSH traffic to all virtual machines in the virtual network. Traffic Analytics dashboards shows the Access Control Lists (ACLs) hitting most traffic. Additional insights can be derived by navigating to Log Analytics workspace and modifying pre-built Kusto queries. To address scenarios such as troubleshooting failed SSH connections, an audit trail of SSH connection attempts from both internal and external IP addresses can be listed.
Scenario 2: Simplifying traffic visibility by enabling virtual network flow logs on hub virtual network
Virtual network flow logs allow optimization of log volume and simplification of management by enabling them at hub virtual network. All traffic flowing through the hub, including spoke-to-spoke traffic is recorded on the hub virtual network. In the topology of demo environment, traffic between the spokes is routed via hub firewall. The example query below aggregates throughput between internal IP addresses for specified ranges. An endpoint on Spoke2 (10.1.2.20) can be seen accessing another API endpoint on Spoke1(10.1.1.21) on port 8080, connecting to Web endpoint on Spoke1(10.1.1.4) via SSH and establishing DNS connectivity with Hub(10.1.0.8) on port 53. Traffic patterns between spoke virtual networks can be aggregated over time to distinguish hub-to-spoke vs spoke-to-spoke volume.
Scenario 3: Hybrid traffic visibility with ExpressRoute gateway
Typical enterprise deployments include a combination of Azure and on-premises workloads with significant traffic traversing ExpressRoute or VPN gateways. Estimating the overall traffic volume on ExpressRoute circuits and identifying the workloads that are consuming significant bandwidth on these circuits enables capacity planning, cross-charging internal teams, or re-architecting application communication to optimize costs. Further investigation to identify the top consumer of bandwidth (26%) in this ExpressRoute circuit (10.4.2.2) can be achieved to list top communicating endpoints, as well as timeline view of bandwidth patterns to eliminate anomalous patterns.
Conclusion
Virtual network flow logs enable centralized visibility of traffic patterns across virtual machines and scale sets, application gateways, load balancers, ExpressRoute gateways, VPN gateways and firewalls. Network and security administrators can leverage these flow logs to ensure organizational needs around network observability and compliance are met in a light-weight scalable manner. In addition, virtual network flow logs enable detection of security vulnerabilities and aid in threat hunting investigations with a complete trail of user and application activity.
Virtual network flow logs currently support the following 3rd party applications with seamless integration for additional scenarios:
Cisco XDR
Darktrace
IBM QRadar
Splunk
Virtual network flow logs will eventually be billed per gigabyte of logs generated. For more information, see Network Watcher pricing (Network flow logs collected).
Learn more
Network Watcher overview
Virtual network flow logs overview
Enable virtual network flow logs
Traffic Analytics overview
Traffic Analytics usage scenarios
Microsoft Tech Community – Latest Blogs –Read More
Content Deleted non nan
nonnon non error MATLAB Answers — New Questions
Struggling to decide the sampling frequency for this fft plot
clear all
close all
clc
L=10;
n=1.45;
Can you guys help me with assigning the frequency values along the x axis , I am bit confused on how to determine the sampling frequency for a fft
c=2.9979e8;
dt = 6e-12;
T=10*2*L*n/c;
t = (-T/2/dt:1:T/2/dt)*dt;
Nt=round(T/dt);
fsine = 1e9;
vsine = 1;
phi = vsine*sin(2*pi*fsine*t);
EL1t=1.274e7*exp(1i*phi);
FP=fft(phi);
fs=(-Nt/2:1:Nt/2-1);
Z=plot(fs,fftshift(abs(fft(EL1t))));clear all
close all
clc
L=10;
n=1.45;
Can you guys help me with assigning the frequency values along the x axis , I am bit confused on how to determine the sampling frequency for a fft
c=2.9979e8;
dt = 6e-12;
T=10*2*L*n/c;
t = (-T/2/dt:1:T/2/dt)*dt;
Nt=round(T/dt);
fsine = 1e9;
vsine = 1;
phi = vsine*sin(2*pi*fsine*t);
EL1t=1.274e7*exp(1i*phi);
FP=fft(phi);
fs=(-Nt/2:1:Nt/2-1);
Z=plot(fs,fftshift(abs(fft(EL1t)))); clear all
close all
clc
L=10;
n=1.45;
Can you guys help me with assigning the frequency values along the x axis , I am bit confused on how to determine the sampling frequency for a fft
c=2.9979e8;
dt = 6e-12;
T=10*2*L*n/c;
t = (-T/2/dt:1:T/2/dt)*dt;
Nt=round(T/dt);
fsine = 1e9;
vsine = 1;
phi = vsine*sin(2*pi*fsine*t);
EL1t=1.274e7*exp(1i*phi);
FP=fft(phi);
fs=(-Nt/2:1:Nt/2-1);
Z=plot(fs,fftshift(abs(fft(EL1t)))); fft, plot MATLAB Answers — New Questions
[SOLVED] UAV Toolbox Support Package can’t detect WSL2
I followed installation document, but Matlab can’t detect WSL2 so I can not configure
Things that i already do
– Reinstall MATLAB
– Reinstall WSL2 with Ubuntu 20.04 LTS using command wsl –install Ubuntu-20.04
– Rebooting
Environment
Window 10 22H2 Build 19045.4291
MATLAB 2024a
WSL version: 2.1.5.0
Kernal version: 5.15.146.1-2I followed installation document, but Matlab can’t detect WSL2 so I can not configure
Things that i already do
– Reinstall MATLAB
– Reinstall WSL2 with Ubuntu 20.04 LTS using command wsl –install Ubuntu-20.04
– Rebooting
Environment
Window 10 22H2 Build 19045.4291
MATLAB 2024a
WSL version: 2.1.5.0
Kernal version: 5.15.146.1-2 I followed installation document, but Matlab can’t detect WSL2 so I can not configure
Things that i already do
– Reinstall MATLAB
– Reinstall WSL2 with Ubuntu 20.04 LTS using command wsl –install Ubuntu-20.04
– Rebooting
Environment
Window 10 22H2 Build 19045.4291
MATLAB 2024a
WSL version: 2.1.5.0
Kernal version: 5.15.146.1-2 #wsl2, #uav toolbox, #px4 MATLAB Answers — New Questions
Calling multiple functions from inside one
Okay fellow coders, I am assembling a bunch of puzzle pieces to form a picture but I am having difficulty… I have a bunch of functions I’ve created that each do specific tasks. I am now trying to call them from the "final" function to do some calculations. I have a flow chart but I’m just not sure how to call multiple functions and have them perform their designated task in the correct manner. The functions are:
% Function 1
function m_kg=lb2kg_ZLKW(w_lb)
m_kg=1/2.2.*w_lb;
end
% Code used to call function:
% w_lb=0:1:100; m_kg=lb2kg_ZLKW(w_lb);
% Function 2
function x0=getx0_ZLKW(k,F)
x0=F./k;
end
% Code used to call function:
% k=linspace(1,10,100); F=1:100; x0=getx0_ZLKW(k,F);
% Function 3
function wn=natfreq_ZLKW(k,m_kg)
wn=sqrt(k./m_kg); % Natural frequency of the system
end
% Code used to call function:
% k=linspace(1,10,100); m_kg=1:100; wn=natfreq_ZLKW(k,m_kg);
% Function 4
function [zeta,wd]=damp_ZLKW(c,m_kg,wn)
zeta=c./(2.*wn.*m_kg);
wd=wn.*sqrt(1-zeta.^2);
end
% Code used to call function:
% c=rand(1,100)*(1); m_kg=1:100; wn=rand(1,100)*1; [zeta,wd]=damp_ZLKW(c,m_kg,wn)
% Function 5
function xN=motionN_ZLKW(zetaN,wnN,wdN,x0N,t)
s1=-wnN*zetaN-wdN*1i;
s2=-wnN*zetaN+wdN*1i;
C1=-((s2*x0N)/s1-s2);
C2=x0N-C1;
xN=C1*exp(s1*t)+C2*exp(s2*t);
end
% Code used to call function: (All of which are scalars except time, t)
% zetaN=0.25; wnN=0.5; wdN=0.75; x0N=10; t=linspace(1,10,100); xN=motionN_ZLKW(zetaN,wnN,wdN,x0N,t)
All of these functions are in their own seperate .m files in the same folder I am calling them from in the final function. The final function will be something like:
% Final function
function [wn,zeta] = main24S_ZLKW(w,k,c,F)
% Trying to figure out how to start this here based on my flowchart
end
I know it seems like a lot, but I am just trying to get the ball rolling and the brain juices flowing here.Okay fellow coders, I am assembling a bunch of puzzle pieces to form a picture but I am having difficulty… I have a bunch of functions I’ve created that each do specific tasks. I am now trying to call them from the "final" function to do some calculations. I have a flow chart but I’m just not sure how to call multiple functions and have them perform their designated task in the correct manner. The functions are:
% Function 1
function m_kg=lb2kg_ZLKW(w_lb)
m_kg=1/2.2.*w_lb;
end
% Code used to call function:
% w_lb=0:1:100; m_kg=lb2kg_ZLKW(w_lb);
% Function 2
function x0=getx0_ZLKW(k,F)
x0=F./k;
end
% Code used to call function:
% k=linspace(1,10,100); F=1:100; x0=getx0_ZLKW(k,F);
% Function 3
function wn=natfreq_ZLKW(k,m_kg)
wn=sqrt(k./m_kg); % Natural frequency of the system
end
% Code used to call function:
% k=linspace(1,10,100); m_kg=1:100; wn=natfreq_ZLKW(k,m_kg);
% Function 4
function [zeta,wd]=damp_ZLKW(c,m_kg,wn)
zeta=c./(2.*wn.*m_kg);
wd=wn.*sqrt(1-zeta.^2);
end
% Code used to call function:
% c=rand(1,100)*(1); m_kg=1:100; wn=rand(1,100)*1; [zeta,wd]=damp_ZLKW(c,m_kg,wn)
% Function 5
function xN=motionN_ZLKW(zetaN,wnN,wdN,x0N,t)
s1=-wnN*zetaN-wdN*1i;
s2=-wnN*zetaN+wdN*1i;
C1=-((s2*x0N)/s1-s2);
C2=x0N-C1;
xN=C1*exp(s1*t)+C2*exp(s2*t);
end
% Code used to call function: (All of which are scalars except time, t)
% zetaN=0.25; wnN=0.5; wdN=0.75; x0N=10; t=linspace(1,10,100); xN=motionN_ZLKW(zetaN,wnN,wdN,x0N,t)
All of these functions are in their own seperate .m files in the same folder I am calling them from in the final function. The final function will be something like:
% Final function
function [wn,zeta] = main24S_ZLKW(w,k,c,F)
% Trying to figure out how to start this here based on my flowchart
end
I know it seems like a lot, but I am just trying to get the ball rolling and the brain juices flowing here. Okay fellow coders, I am assembling a bunch of puzzle pieces to form a picture but I am having difficulty… I have a bunch of functions I’ve created that each do specific tasks. I am now trying to call them from the "final" function to do some calculations. I have a flow chart but I’m just not sure how to call multiple functions and have them perform their designated task in the correct manner. The functions are:
% Function 1
function m_kg=lb2kg_ZLKW(w_lb)
m_kg=1/2.2.*w_lb;
end
% Code used to call function:
% w_lb=0:1:100; m_kg=lb2kg_ZLKW(w_lb);
% Function 2
function x0=getx0_ZLKW(k,F)
x0=F./k;
end
% Code used to call function:
% k=linspace(1,10,100); F=1:100; x0=getx0_ZLKW(k,F);
% Function 3
function wn=natfreq_ZLKW(k,m_kg)
wn=sqrt(k./m_kg); % Natural frequency of the system
end
% Code used to call function:
% k=linspace(1,10,100); m_kg=1:100; wn=natfreq_ZLKW(k,m_kg);
% Function 4
function [zeta,wd]=damp_ZLKW(c,m_kg,wn)
zeta=c./(2.*wn.*m_kg);
wd=wn.*sqrt(1-zeta.^2);
end
% Code used to call function:
% c=rand(1,100)*(1); m_kg=1:100; wn=rand(1,100)*1; [zeta,wd]=damp_ZLKW(c,m_kg,wn)
% Function 5
function xN=motionN_ZLKW(zetaN,wnN,wdN,x0N,t)
s1=-wnN*zetaN-wdN*1i;
s2=-wnN*zetaN+wdN*1i;
C1=-((s2*x0N)/s1-s2);
C2=x0N-C1;
xN=C1*exp(s1*t)+C2*exp(s2*t);
end
% Code used to call function: (All of which are scalars except time, t)
% zetaN=0.25; wnN=0.5; wdN=0.75; x0N=10; t=linspace(1,10,100); xN=motionN_ZLKW(zetaN,wnN,wdN,x0N,t)
All of these functions are in their own seperate .m files in the same folder I am calling them from in the final function. The final function will be something like:
% Final function
function [wn,zeta] = main24S_ZLKW(w,k,c,F)
% Trying to figure out how to start this here based on my flowchart
end
I know it seems like a lot, but I am just trying to get the ball rolling and the brain juices flowing here. functions MATLAB Answers — New Questions

How fix QuickBooks Error 30159 after update Payroll?
Troubleshooting Solutions: QuickBooks Payroll Update Error 30159
Check Payroll Subscription: QuickBooks Error 30159 often occurs due to issues with the payroll subscription. Ensure your payroll subscription is active and up-to-date by logging into your Intuit account and verifying your subscription status.Update QuickBooks: Make sure you’re using the latest version of QuickBooks. Outdated software can trigger errors like 30159. Go to the “Help” menu and select “Update QuickBooks” to install any available updates.Run QuickBooks Payroll Update: QuickBooks often releases payroll updates to fix errors and enhance functionality. Run the latest payroll update by selecting “Employees” > “Get Payroll Updates” > “Download Entire Update.”Check Payroll Service Key: Verify that the payroll service key is correct in QuickBooks. Navigate to “Employees” > “My Payroll Service” > “Manage Service Keys.” If the key is incorrect, click “Edit” and enter the correct service key.Repair QuickBooks Installation: A corrupted QuickBooks installation can lead to error 30159. Use the QuickBooks Install Diagnostic Tool to repair the installation. Download and run the tool from the Intuit website to fix any installation-related issues.Update Windows and .NET Framework: Ensure that your Windows operating system and .NET Framework are updated. QuickBooks relies on these components, and outdated versions can cause compatibility issues. Check for updates in the Windows Update settings.Scan for Malware/Viruses: Malware or viruses on your system can interfere with QuickBooks processes, leading to error 30159. Run a thorough scan using reputable antivirus software to detect and remove any malicious programs.Check Firewall and Security Software: Your firewall or security software may be blocking QuickBooks from accessing necessary resources. Temporarily disable your firewall and security software, then try running QuickBooks again. If the error disappears, adjust your firewall settings to allow QuickBooks access.Contact QuickBooks Support: If none of the above solutions resolve the error, contact QuickBooks support for further assistance. They can provide advanced troubleshooting steps or address any underlying technical issues causing error 30159.
By following these troubleshooting steps, you should be able to resolve QuickBooks Error 30159 and resume your workflow without interruption.
Troubleshooting Solutions: QuickBooks Payroll Update Error 30159 Check Payroll Subscription: QuickBooks Error 30159 often occurs due to issues with the payroll subscription. Ensure your payroll subscription is active and up-to-date by logging into your Intuit account and verifying your subscription status.Update QuickBooks: Make sure you’re using the latest version of QuickBooks. Outdated software can trigger errors like 30159. Go to the “Help” menu and select “Update QuickBooks” to install any available updates.Run QuickBooks Payroll Update: QuickBooks often releases payroll updates to fix errors and enhance functionality. Run the latest payroll update by selecting “Employees” > “Get Payroll Updates” > “Download Entire Update.”Check Payroll Service Key: Verify that the payroll service key is correct in QuickBooks. Navigate to “Employees” > “My Payroll Service” > “Manage Service Keys.” If the key is incorrect, click “Edit” and enter the correct service key.Repair QuickBooks Installation: A corrupted QuickBooks installation can lead to error 30159. Use the QuickBooks Install Diagnostic Tool to repair the installation. Download and run the tool from the Intuit website to fix any installation-related issues.Update Windows and .NET Framework: Ensure that your Windows operating system and .NET Framework are updated. QuickBooks relies on these components, and outdated versions can cause compatibility issues. Check for updates in the Windows Update settings.Scan for Malware/Viruses: Malware or viruses on your system can interfere with QuickBooks processes, leading to error 30159. Run a thorough scan using reputable antivirus software to detect and remove any malicious programs.Check Firewall and Security Software: Your firewall or security software may be blocking QuickBooks from accessing necessary resources. Temporarily disable your firewall and security software, then try running QuickBooks again. If the error disappears, adjust your firewall settings to allow QuickBooks access.Contact QuickBooks Support: If none of the above solutions resolve the error, contact QuickBooks support for further assistance. They can provide advanced troubleshooting steps or address any underlying technical issues causing error 30159.By following these troubleshooting steps, you should be able to resolve QuickBooks Error 30159 and resume your workflow without interruption. Read More
Henvisningskode B I T G E T: qp29 (B I T G E T 1000 USDT registreringsbonus) | Ny kampagnekode
Henvisningskode B I T G E T: qp29 (B I T G E T 1000 USDT registreringsbonus) | Ny kampagnekode B I T G E T 2024
Leder du efter henvisningskode B I T G E T? Den sidste for 2024 er qp29. Med denne kode får du 30% rabat. Derudover kan nye BIT G E T-brugere, der tilmelder sig med kampagnekoden “qp29”, modtage en eksklusiv kampagnebelønning til en værdi af op til $1.000.
Hvad er henvisningskoden B I T G E T?
Koden “qp29” i BIT G E T-programmet fungerer som en henvisningskode. Ved at indtaste denne kode vil du modtage en permanent reduktion i handelsgebyrer samt 30% rabat på dine handler. Plus, hvis du deler din henvisningskode med dine venner, har du en chance for at vinde en generøs 50% bonus. Brug af denne kode giver en værdifuld mulighed for at reducere gebyrer og potentielt øge din indtjening ved at tiltrække andre til platformen.
Hvad er den bedste B I T G E T 2024 henvisningskode?
Den stærkt anbefalede B I T G E T-henvisningskode er qp29. Hvis du bruger denne kode, når du tilmelder dig, vil du modtage en generøs $100 bonus. Hvis du deler din kode med dine venner, har du mulighed for at tjene en kæmpe kommission på 50%. Dette giver dig i bund og grund muligheden for at modtage en maksimal tilmeldingsbonus på op til $1.000 som en velkomstbelønning. Dette er en fantastisk måde at udvide din handelsoplevelse med yderligere fordele, mens du opmuntrer andre til at deltage og tjene deres egne belønninger.
Sådan bruger du henvisningskoden B I T G E T
Henvisningskoden B I T G E T er tilgængelig for nye brugere, som endnu ikke er registreret på børsen. Hvis du allerede har en konto, vil du desværre ikke kunne bruge henvisningskoden.
B I T G E T tilbyder dog flere andre måder at deltage i kampagner og optjene belønninger på. Lad os se på disse alternativer.
For B I T G E T nybegyndere er her trin-for-trin instruktioner om, hvordan man ansøger om en henvisningskode:
For at komme i gang skal du besøge B I T G E T og klikke på den blå “Log ind”-knap.
Angiv nøjagtige brugeroplysninger, da de vil blive kontrolleret for overholdelse af KYC- og AML-procedurer.
Når du bliver bedt om din henvisningskode, skal du indtaste qp29.
Fuldfør registreringsprocessen og fuldfør alle nødvendige bekræftelser.
Når alle betingelser er opfyldt, kan du straks modtage velkomstbonussen.
Denne tilgang sikrer, at nye brugere nemt kan gennemføre registreringsprocessen selv uden en henvisningskode og modtage en velkomstbonus efter at have opfyldt de fastsatte krav.
Hvad er den anbefalede henvisningskode for B I T G E T?
Henvisningskode B I T G E T – qp29. For at få 30 % rabat på din B I T G E T-kommission skal du blot følge disse trin:
Registrer en ny konto hos B I T G E T.
Sørg for at bruge referencekoden B I T G E T qp29.
Hvor meget er henvisningsbonussen for B I T G E T?
Inviter dine venner til at deltage i B I T G E T og vind en del af henvisningspræmiepuljen sammen! Hver ven, du henviser, kan tjene $50, op til et maksimum på $1.000 pr. bruger. Brugere kan invitere venner til at registrere sig hos B I T G E T. Hvis de opfylder alle kravene, vil du og dine venner modtage handelsbonusser på $50 op til maksimumgrænsen.
Hvordan får jeg B I T G E T bonussen?
Optjen point dagligt og veksle dem til USDT. Gennemfør udfordringen inden for syv dage for at låse op for alle belønninger. Tilmeld dig for at modtage en velkomstpakke til en værdi af $1.000. Indbetal mindst $50 for at optjene 200 point. Lav din første handel til en værdi af mindst $50 og optjen 500 point.
Anvendes handelskommissionsrabatter automatisk?
Absolut. Når du registrerer dig med vores eksklusive henvisningskode B I T G E T qp29, vil 30% rabatten blive anvendt automatisk. Der kræves ingen yderligere handling. Du skal bare dykke ned i handel og nyde godt af en permanent 30 % rabat på alle kommissioner.
Henvisningskode B I T G E T: qp29 (B I T G E T 1000 USDT registreringsbonus) | Ny kampagnekode B I T G E T 2024Leder du efter henvisningskode B I T G E T? Den sidste for 2024 er qp29. Med denne kode får du 30% rabat. Derudover kan nye BIT G E T-brugere, der tilmelder sig med kampagnekoden “qp29”, modtage en eksklusiv kampagnebelønning til en værdi af op til $1.000.Hvad er henvisningskoden B I T G E T?Koden “qp29” i BIT G E T-programmet fungerer som en henvisningskode. Ved at indtaste denne kode vil du modtage en permanent reduktion i handelsgebyrer samt 30% rabat på dine handler. Plus, hvis du deler din henvisningskode med dine venner, har du en chance for at vinde en generøs 50% bonus. Brug af denne kode giver en værdifuld mulighed for at reducere gebyrer og potentielt øge din indtjening ved at tiltrække andre til platformen.Hvad er den bedste B I T G E T 2024 henvisningskode?Den stærkt anbefalede B I T G E T-henvisningskode er qp29. Hvis du bruger denne kode, når du tilmelder dig, vil du modtage en generøs $100 bonus. Hvis du deler din kode med dine venner, har du mulighed for at tjene en kæmpe kommission på 50%. Dette giver dig i bund og grund muligheden for at modtage en maksimal tilmeldingsbonus på op til $1.000 som en velkomstbelønning. Dette er en fantastisk måde at udvide din handelsoplevelse med yderligere fordele, mens du opmuntrer andre til at deltage og tjene deres egne belønninger.Sådan bruger du henvisningskoden B I T G E THenvisningskoden B I T G E T er tilgængelig for nye brugere, som endnu ikke er registreret på børsen. Hvis du allerede har en konto, vil du desværre ikke kunne bruge henvisningskoden.B I T G E T tilbyder dog flere andre måder at deltage i kampagner og optjene belønninger på. Lad os se på disse alternativer.For B I T G E T nybegyndere er her trin-for-trin instruktioner om, hvordan man ansøger om en henvisningskode:For at komme i gang skal du besøge B I T G E T og klikke på den blå “Log ind”-knap.Angiv nøjagtige brugeroplysninger, da de vil blive kontrolleret for overholdelse af KYC- og AML-procedurer.Når du bliver bedt om din henvisningskode, skal du indtaste qp29.Fuldfør registreringsprocessen og fuldfør alle nødvendige bekræftelser.Når alle betingelser er opfyldt, kan du straks modtage velkomstbonussen.Denne tilgang sikrer, at nye brugere nemt kan gennemføre registreringsprocessen selv uden en henvisningskode og modtage en velkomstbonus efter at have opfyldt de fastsatte krav.Hvad er den anbefalede henvisningskode for B I T G E T?Henvisningskode B I T G E T – qp29. For at få 30 % rabat på din B I T G E T-kommission skal du blot følge disse trin:Registrer en ny konto hos B I T G E T.Sørg for at bruge referencekoden B I T G E T qp29.Hvor meget er henvisningsbonussen for B I T G E T?Inviter dine venner til at deltage i B I T G E T og vind en del af henvisningspræmiepuljen sammen! Hver ven, du henviser, kan tjene $50, op til et maksimum på $1.000 pr. bruger. Brugere kan invitere venner til at registrere sig hos B I T G E T. Hvis de opfylder alle kravene, vil du og dine venner modtage handelsbonusser på $50 op til maksimumgrænsen.Hvordan får jeg B I T G E T bonussen?Optjen point dagligt og veksle dem til USDT. Gennemfør udfordringen inden for syv dage for at låse op for alle belønninger. Tilmeld dig for at modtage en velkomstpakke til en værdi af $1.000. Indbetal mindst $50 for at optjene 200 point. Lav din første handel til en værdi af mindst $50 og optjen 500 point.Anvendes handelskommissionsrabatter automatisk?Absolut. Når du registrerer dig med vores eksklusive henvisningskode B I T G E T qp29, vil 30% rabatten blive anvendt automatisk. Der kræves ingen yderligere handling. Du skal bare dykke ned i handel og nyde godt af en permanent 30 % rabat på alle kommissioner. Read More
Link up mailbox to exchange online from on-premise exchange
We got customer using the below.
1 x on-premise exchange server
Active M365 admin portal with users account synced online via AD sync from on-premise AD but without mailbox.
Mailbox are on-premise exchange.
Now we need to assign M365 mailbox to active user account on exchange online.
Because we tried assign in exchange online but it prompt on-premise exchange server detected and can’t proceed.
What is the best method to do so?
Thanks.
We got customer using the below.1 x on-premise exchange server Active M365 admin portal with users account synced online via AD sync from on-premise AD but without mailbox. Mailbox are on-premise exchange. Now we need to assign M365 mailbox to active user account on exchange online.Because we tried assign in exchange online but it prompt on-premise exchange server detected and can’t proceed. What is the best method to do so? Thanks. Read More
Shared calendars not syncing for others
I have created three calendars which have been shared by email with the organisation I work at. Some people do not receive updates when calendar events are amended (i.e., updates do not sync). Is this a regular glitch?
I have created three calendars which have been shared by email with the organisation I work at. Some people do not receive updates when calendar events are amended (i.e., updates do not sync). Is this a regular glitch? Read More


