

Category: News
Import data from *.ch file
Hello – has anyone ever tried to import gas chromatograph data from files with .ch extension?Hello – has anyone ever tried to import gas chromatograph data from files with .ch extension? Hello – has anyone ever tried to import gas chromatograph data from files with .ch extension? chromatogram, import, data MATLAB Answers — New Questions
How to generate IP block from QAM receiver example?
I want to generate an IP block from the QAM receiver part from this example:
https://www.mathworks.com/help/comm/ug/hdl-optimized-qam-transmitter-and-receiver.html?searchHighlight=hdl%20qam64&s_tid=srchtitle_support_results_1_hdl%20qam64
To generate an IP core with AXI-stream slave interface using HDL coder it is necessary to specify the valid signal. I do not know what is the right approach to address this.
The model contains a rate transition (there is decimation filter in the Coarse Frequency
Offset Correction ) so it is not possible just wrap the whole system into one enabled subsystem, how it is suggested in this example:
https://www.mathworks.com/help/hdlcoder/ug/model-design-for-axi4-stream-interface-generation.html
How to handle the valid-in signal? Should I split the model to two (or more) enabled submodels before and after the rate transition? Should I manually downsample the valid signal using the downsample block and use the right number of delays to synchronize it?
Is the example just a demonstration of the HDL libraries that nobody intended to use for HDL code generation? What do I miss?I want to generate an IP block from the QAM receiver part from this example:
https://www.mathworks.com/help/comm/ug/hdl-optimized-qam-transmitter-and-receiver.html?searchHighlight=hdl%20qam64&s_tid=srchtitle_support_results_1_hdl%20qam64
To generate an IP core with AXI-stream slave interface using HDL coder it is necessary to specify the valid signal. I do not know what is the right approach to address this.
The model contains a rate transition (there is decimation filter in the Coarse Frequency
Offset Correction ) so it is not possible just wrap the whole system into one enabled subsystem, how it is suggested in this example:
https://www.mathworks.com/help/hdlcoder/ug/model-design-for-axi4-stream-interface-generation.html
How to handle the valid-in signal? Should I split the model to two (or more) enabled submodels before and after the rate transition? Should I manually downsample the valid signal using the downsample block and use the right number of delays to synchronize it?
Is the example just a demonstration of the HDL libraries that nobody intended to use for HDL code generation? What do I miss? I want to generate an IP block from the QAM receiver part from this example:
https://www.mathworks.com/help/comm/ug/hdl-optimized-qam-transmitter-and-receiver.html?searchHighlight=hdl%20qam64&s_tid=srchtitle_support_results_1_hdl%20qam64
To generate an IP core with AXI-stream slave interface using HDL coder it is necessary to specify the valid signal. I do not know what is the right approach to address this.
The model contains a rate transition (there is decimation filter in the Coarse Frequency
Offset Correction ) so it is not possible just wrap the whole system into one enabled subsystem, how it is suggested in this example:
https://www.mathworks.com/help/hdlcoder/ug/model-design-for-axi4-stream-interface-generation.html
How to handle the valid-in signal? Should I split the model to two (or more) enabled submodels before and after the rate transition? Should I manually downsample the valid signal using the downsample block and use the right number of delays to synchronize it?
Is the example just a demonstration of the HDL libraries that nobody intended to use for HDL code generation? What do I miss? qam, axi-stream, multirate, hdl coder, valid signal MATLAB Answers — New Questions
Disappointment with change to section highlighting and run section capability in MATLAB functions after MATLAB 2020b
There is significant information on MATLAB central about this topic already. Here’s a typical question, paraphrased by me:
I recently upgraded from MATLAB 2020b to MATLAB 2023b. I can no longer highlight sections nor can I run sections. How can I recover the old capability?
Here’s my answer:
The new highlighting and run section capability is limited to scripts, not functions in the newer versions of MATLAB! Even with scripts, highlighting requires that one right-click on the left margin (the one with the line numbers) and ensure "Show code folding margin" is enabled with a check mark. This allows a blue bar to be displayed in the margin of the current section (that is, the one in which the cursor appears). The section can be run using either the menu or by clicking the blue bar. But only in scripts, not functions!
Here’s are my disappointments:
In the older versions, I really appreciated the ability to highlight the current section. I prefer to write functions rather than scripts, because I frequently build them into larger MATLAB systems. The new suppression of the old highlighting capability in functions is a real loss to me — the instant visibility of the current section was very valuable.
Similarly, the inability to run sections in functions is a loss of capability. I did not use it frequently, but many of my colleagues use it all the time. Now when they help work on my codes, they won’t have that capability.
This seemed like a needless loss of capability in an upgrade to the (relatively expensive) software development system that MATLAB represents.
The native MATLAB documentation on this is dreadfully lacking. I have spent hours getting to the bottom of this, searching every menu, preference list, and MATLAB Central posting I can find, to no avail.
The MATLAB Central documentation is all over the map, and there don’t seem to be very clear answers anywhere. (I hope this posting helps.)
Here are my recommendations:
Please restore the highlighting and run section capability for functions in the next MATLAB release!
I far prefer block coloring of the current section than the blue bar. I don’t like the extra margin width required by the code folding margin, and I find the blue bar less visible than coloring of the section.
At minimum, all of this should be tailorable as user options.
Thank you.There is significant information on MATLAB central about this topic already. Here’s a typical question, paraphrased by me:
I recently upgraded from MATLAB 2020b to MATLAB 2023b. I can no longer highlight sections nor can I run sections. How can I recover the old capability?
Here’s my answer:
The new highlighting and run section capability is limited to scripts, not functions in the newer versions of MATLAB! Even with scripts, highlighting requires that one right-click on the left margin (the one with the line numbers) and ensure "Show code folding margin" is enabled with a check mark. This allows a blue bar to be displayed in the margin of the current section (that is, the one in which the cursor appears). The section can be run using either the menu or by clicking the blue bar. But only in scripts, not functions!
Here’s are my disappointments:
In the older versions, I really appreciated the ability to highlight the current section. I prefer to write functions rather than scripts, because I frequently build them into larger MATLAB systems. The new suppression of the old highlighting capability in functions is a real loss to me — the instant visibility of the current section was very valuable.
Similarly, the inability to run sections in functions is a loss of capability. I did not use it frequently, but many of my colleagues use it all the time. Now when they help work on my codes, they won’t have that capability.
This seemed like a needless loss of capability in an upgrade to the (relatively expensive) software development system that MATLAB represents.
The native MATLAB documentation on this is dreadfully lacking. I have spent hours getting to the bottom of this, searching every menu, preference list, and MATLAB Central posting I can find, to no avail.
The MATLAB Central documentation is all over the map, and there don’t seem to be very clear answers anywhere. (I hope this posting helps.)
Here are my recommendations:
Please restore the highlighting and run section capability for functions in the next MATLAB release!
I far prefer block coloring of the current section than the blue bar. I don’t like the extra margin width required by the code folding margin, and I find the blue bar less visible than coloring of the section.
At minimum, all of this should be tailorable as user options.
Thank you. There is significant information on MATLAB central about this topic already. Here’s a typical question, paraphrased by me:
I recently upgraded from MATLAB 2020b to MATLAB 2023b. I can no longer highlight sections nor can I run sections. How can I recover the old capability?
Here’s my answer:
The new highlighting and run section capability is limited to scripts, not functions in the newer versions of MATLAB! Even with scripts, highlighting requires that one right-click on the left margin (the one with the line numbers) and ensure "Show code folding margin" is enabled with a check mark. This allows a blue bar to be displayed in the margin of the current section (that is, the one in which the cursor appears). The section can be run using either the menu or by clicking the blue bar. But only in scripts, not functions!
Here’s are my disappointments:
In the older versions, I really appreciated the ability to highlight the current section. I prefer to write functions rather than scripts, because I frequently build them into larger MATLAB systems. The new suppression of the old highlighting capability in functions is a real loss to me — the instant visibility of the current section was very valuable.
Similarly, the inability to run sections in functions is a loss of capability. I did not use it frequently, but many of my colleagues use it all the time. Now when they help work on my codes, they won’t have that capability.
This seemed like a needless loss of capability in an upgrade to the (relatively expensive) software development system that MATLAB represents.
The native MATLAB documentation on this is dreadfully lacking. I have spent hours getting to the bottom of this, searching every menu, preference list, and MATLAB Central posting I can find, to no avail.
The MATLAB Central documentation is all over the map, and there don’t seem to be very clear answers anywhere. (I hope this posting helps.)
Here are my recommendations:
Please restore the highlighting and run section capability for functions in the next MATLAB release!
I far prefer block coloring of the current section than the blue bar. I don’t like the extra margin width required by the code folding margin, and I find the blue bar less visible than coloring of the section.
At minimum, all of this should be tailorable as user options.
Thank you. highlight section, run section, function sections, script sections MATLAB Answers — New Questions
Lighthouse GDAP setup is sending too many email notifications
We (an MSP) are in the process of setting up GDAP relationships via Microsoft 365 Lighthouse, to better manage our clients’ tenants. We are also cleaning up old clients from our Microsoft Partner Center customer list and removing GDAP relationships from previous license providers. Through a lot of these GDAP changes, our employees are receiving a TON of GDAP email notifications (ex: “Your granular admin relationship with [Client Name] has been terminated” or “the customer approved your granular admin relationship request”). As best I can tell, this appears to be related to the templates/roles/permissions settings in the Lighthouse GDAP setup. However, I can’t specifically find where to change this. What can I change to reduce the number of people in our MSP organization who receive GDAP notifications? Read More
Finding an app add on for teams that best suits our teams problem
Hello,
I work in a solutions service team using a case management system to track problems raised by our customers. I am looking for some ideas and thoughts from some Microsoft teams experts. Our team uses a group chat with around 6 people, and we pick these problems or cases created on a turn basis. We communicate whenever we pick these cases, but have trouble remembering whos turn is next in order. As well as quickly and consistently staying in that pattern.
Such as, the daily order is
* Bob
* Susan
* Craig
* Jackie
Bob picks so he is moved to the bottom of the queue, and it is susans turn. But in certain situations, we lose track and don’t have an order set any given point. Due to one person picking at the end of the day with little cases raised that day, and or starting their shift at a different time. So in an example situation, after a 3 day work week – the queue looks like this.
* Craig
* Jackie
* Bob
* Susan
It’s important we get it accurate in order or who needs to be picking next, or sometimes picking back to back. In order to distribute work load and to not result in a mad coworker.
Is there an app or tool to manage this in our group channel efficiently? Where it will pop to the end of the queue and everyone can see the list. So there is no arguments or wrong picking order.
Thank you, I appreciate any ideas on this.
Hello, I work in a solutions service team using a case management system to track problems raised by our customers. I am looking for some ideas and thoughts from some Microsoft teams experts. Our team uses a group chat with around 6 people, and we pick these problems or cases created on a turn basis. We communicate whenever we pick these cases, but have trouble remembering whos turn is next in order. As well as quickly and consistently staying in that pattern. Such as, the daily order is * Bob* Susan* Craig* Jackie Bob picks so he is moved to the bottom of the queue, and it is susans turn. But in certain situations, we lose track and don’t have an order set any given point. Due to one person picking at the end of the day with little cases raised that day, and or starting their shift at a different time. So in an example situation, after a 3 day work week – the queue looks like this. * Craig* Jackie * Bob* Susan It’s important we get it accurate in order or who needs to be picking next, or sometimes picking back to back. In order to distribute work load and to not result in a mad coworker. Is there an app or tool to manage this in our group channel efficiently? Where it will pop to the end of the queue and everyone can see the list. So there is no arguments or wrong picking order. Thank you, I appreciate any ideas on this. Read More
How to backup (and restore) the Windows 11 registry?
I’m new to Windows 11 (I’m running 23H2, 22631.3447). I would like to install a piece of software (namely, Winaero Tweaker) that will likely make changes to the Windows 11 registry. I would like to backup the registry in case problems arise.
How do I perform a one-time backup of the registry? And how can I restore that backup in case problems arise?
I found a tutorial on how to enable automatic backup of the system registry upon restart, but how do I manually perform a one-time backup of the registry?
I’m new to Windows 11 (I’m running 23H2, 22631.3447). I would like to install a piece of software (namely, Winaero Tweaker) that will likely make changes to the Windows 11 registry. I would like to backup the registry in case problems arise. How do I perform a one-time backup of the registry? And how can I restore that backup in case problems arise? I found a tutorial on how to enable automatic backup of the system registry upon restart, but how do I manually perform a one-time backup of the registry? Read More
Seperating values in a cell based on characters
I am trying to seperate multiple values in a cell based on rather or not they are BOLD. Is this possible without doing it manually (which is what I do now). 🙁
I attached 2 pictures showing the before and what it looks like after manually seperate the values from BOLD and not bold.
I am trying to seperate multiple values in a cell based on rather or not they are BOLD. Is this possible without doing it manually (which is what I do now). 🙁 I attached 2 pictures showing the before and what it looks like after manually seperate the values from BOLD and not bold. Read More
Teams and VMware VDI
I ran the computer install for Teams using the link below. it installs for the user currently logged in, but when I clone the image there is no sign of teams and it does not run automatically when logging in. Any help would be appreciated.
Start at “deploy the new teams client”
https://learn.microsoft.com/en-us/microsoftteams/new-teams-vdi-requirements-deploy
I ran the computer install for Teams using the link below. it installs for the user currently logged in, but when I clone the image there is no sign of teams and it does not run automatically when logging in. Any help would be appreciated. Start at “deploy the new teams client”https://learn.microsoft.com/en-us/microsoftteams/new-teams-vdi-requirements-deploy Read More
Teams chat and planner app trouble
I’ve created a planner in our teams channel. Then I went to the chat and clicked on a message to create it as a task. However, under “create in” the planner is not showing. Only a planner from a different channel that I didn’t create. How can I get my planners to show under “create in” when creating a new task from the Teams chat?
I’ve created a planner in our teams channel. Then I went to the chat and clicked on a message to create it as a task. However, under “create in” the planner is not showing. Only a planner from a different channel that I didn’t create. How can I get my planners to show under “create in” when creating a new task from the Teams chat? Read More
Embracing the Data Protection and Data Privacy Act: A Strategic Approach with Microsoft’s Compliance
In an era where data breaches and privacy concerns are at the forefront of concerns, the Data Protection and Data Privacy (DPDP) Act 2023 emerges to enhance protection for individuals’ personal information. This landmark legislation signifies a pivotal shift in the global data privacy landscape, imposing rigorous standards for data handling and compelling organizations to elevate their data protection measures. As we navigate the intricacies of compliance with the DPDP. Microsoft Compliance Manager emerges as a tool to help our customers meet regulatory obligations. Compliance regulations protect customers and the organizations they serve, and Microsoft Compliance Manager is here to help protect private data.
Unpacking the DPDP Act 2023
The DPDP Act 2023 introduces a stringent legal framework aimed at safeguarding personal data against misuse, unauthorized access, and breaches. It mandates comprehensive data protection protocols, consent mechanisms for data collection, and stringent penalties for non-compliance, thereby setting a new benchmark for data privacy. This act underscores the importance of responsible data stewardship, emphasizing transparency, security, and the individual’s right to privacy.
For organizations, the enactment of the DPDP Act 2023 signifies a call to action—a mandate to reassess and fortify their data handling practices. It necessitates a holistic approach to data privacy, requiring robust governance, risk management, and compliance (GRC) frameworks to ensure adherence to the law. This is where the strategic deployment of Microsoft’s Compliance Manager can make a substantial difference.
Microsoft’s Compliance Manager: Facilitating Seamless Compliance
Microsoft’s Compliance Manager is a comprehensive solution designed to streamline the journey towards compliance with the DPDP Act 2023. It serves as a central hub for compliance activities, offering a suite of tools and features that simplify the complex landscape of data protection regulations. Key functionalities include:
Comprehensive Risk Assessments: Compliance Manager enables organizations to conduct thorough risk assessments, identifying potential vulnerabilities in their data handling processes and implementing corrective measures to mitigate these risks.
Customizable Compliance Frameworks: With the flexibility to tailor compliance frameworks to specific regulatory requirements, businesses can ensure that their compliance efforts are both efficient and effective.
Automated Compliance Tracking: The tool automates the tracking of compliance tasks, deadlines, and documentation, ensuring that nothing falls through the cracks and that organizations remain on track with their compliance obligations.
By integrating Compliance Manager into their operational fabric, organizations can navigate the DPDP Act’s requirements with confidence, ensuring that their data protection practices are both robust and compliant.
Transforming Compliance into Competitive Advantage
The strategic adoption of Compliance Manager in response to the DPDP Act 2023 extends beyond mere compliance; it empowers organizations to transform regulatory adherence into a competitive edge. This transformation is anchored in several key benefits:
Building Consumer Trust: In today’s digital economy, consumer trust is paramount. Compliance Manager helps organizations demonstrate their commitment to data privacy, thereby building trust and loyalty among customers.
Fostering Innovation: By providing a clear framework for compliant data handling, Compliance Manager encourages organizations to innovate within the bounds of regulatory requirements, driving growth and differentiation in the market.
Optimizing Operational Efficiency: The automation and centralization of compliance tasks reduce the time and resources dedicated to compliance, allowing organizations to focus on their core business objectives.
Conclusion: The Road Ahead with Compliance Manager
As the DPDP Act 2023 ushers in a new era of data privacy, Microsoft’s Compliance Manager stands at the forefront, offering organizations a powerful tool to achieve compliance and harness it as a strategic asset. Through its comprehensive features, Compliance Manager not only addresses the immediate challenges posed by the DPDP Act but also lays the groundwork for sustained growth and innovation within a secure and compliant framework.
In embracing Compliance Manager, businesses can look forward to not just navigating the complexities of the DPDP Act 2023 but thriving in the new landscape it creates. This strategic alignment between compliance and business objectives marks a new chapter in data privacy, one where regulatory adherence fuels innovation and competitive advantage. As we move forward, Compliance Manager will undoubtedly play a pivotal role in shaping the future of data protection and privacy, driving the need for its adoption across industries.
Microsoft Tech Community – Latest Blogs –Read More
Operationalizing Attack Path Insights
In the face of today’s complex cybersecurity challenges, the ability to proactively manage and mitigate potential attack vectors has never been more crucial. Identifying, understanding, and countering attack paths effectively are essential steps in safeguarding an organization’s digital assets. This Azure Workbook Attack Path Dashboard has been designed for monitoring attack paths over time—ranging from days to a month or more. This tool empowers organizations to leverage deep insights into their cybersecurity posture, enabling them to evaluate and enhance their processes for mitigating threats proactively. This blog article explores the dashboard’s layout, its detailed insights, and how it supports organizations in enhancing their security posture.
How Implement the Workbook – Requirements
To implement the workbook you must enable Defender for Cloud Continuous Export feature at the Subscription level, select the export Security Attack Paths data and the Azure Log Analytics Workspace to store the data. The configuration is done through Defender for Cloud Environment Settings.
Here, select the Subscription and select Continuous Export. Configure the settings and save.
Note: Data exported to the Log Analytics Workspace is subject to the Workspace ingestion cost. Learn more about Log Analytics pricing and the many techniques to optimize your cost. Data retention is by default 31 days, however longer retention can be configured -90 days is recommended for an optimal time rage analysis (longer retention will incur additional charges as explained in Log Analytics pricing). Upon activation, the system will begin populating the designated Workspace with data as it updates the Attack Paths. This process is typically completed within 24 hours, at which point the initial data records will be visible.
Dashboard Layout and Insights
The Attack Path Dashboard features an intuitive layout design that makes monitoring and analyzing attack paths over time not just more manageable, but also more effective. This dashboard stands out not only for its user-friendly interface but for the insights it provides into the attack path over time analysis. Below, we explore the key features that make this tool an asset for security teams.
Latest vs. Previous Attack Path Distribution
One of the dashboard’s standout features is its ability to differentiate between the latest and previous attack paths. This distinction is critical for security teams to immediately identify new potential threats as they surface in your environment, allowing for the swift prioritization of responses. By comparing current attack paths against historical data, teams can allocate their resources more efficiently, focusing on newly detected vulnerabilities while continuing to monitor ongoing threats.
Risk Level Distribution Over Time
Understanding how risk levels of attack paths evolve over time is essential for strategic planning and defense optimization. The dashboard’s dynamic visualization of risk level distributions—categorized into critical, high, and medium—over various time frames provide a clear picture of possible threat evolution. While this chart may not delineate specific attack methodologies, its value lies in enabling security teams to quickly assess and prioritize the severity of possible attack vectors and their volume variation over time. By observing trends in the volume of critical versus less severe attack paths, teams can plan remediation strategies accordingly.
Overall Number of Attack Paths Over Time
The chart offers a visual summary of the attack paths detected over a selected time frame, illustrating the outcomes of security monitoring efforts. It doesn’t predict when attacks might happen but shows the results of the security team’s vigilance in identifying potential vulnerabilities. A consistent decline in detected paths could suggest that proper security posture and defensive measures are improving, while an increase may signal the need for a review of current security protocols. This type of chart adds value by helping security teams measure the effectiveness of their strategies, adjust their focus, and monitor their progress.
Active vs. Resolved Attack Paths
The dashboard further enhances operational transparency by categorizing attack paths as either active or resolved. This classification, coupled with metrics such as the duration of activity and new identifications, sheds light on the security team’s effectiveness and responsiveness. The inclusion of the Mean Time to Remediation (MTTR) metric provides an additional layer of insight, allowing teams to gauge the urgency and efficiency of their responses across different threat levels.
Active vs. Resolved Overtime
Visualizing the relationship between active and resolved attack paths overtime offers a narrative of the security team’s ongoing efforts and challenges. This time chart distribution is an important tool for assessing progress, identifying periods of high threat activity, and evaluating the success of mitigation strategies.
Risk Factor, Target, and Entry Point Distribution
Delving deeper into the nature of threats, the dashboard provides a granular analysis of attack paths by risk factors, targeted resources, and entry points. This breakdown identifies the most exploited vulnerabilities and high-risk assets, enabling security teams to tailor their defense mechanisms and prioritize hardening efforts where they are most needed.
MITRE TTPs Distribution
The analysis of MITRE Tactics, Techniques, and Procedures (TTPs) distribution grants a strategic overview of prevalent attack methodologies. By understanding the tactics and techniques favored by adversaries, security teams can anticipate potential threats and refine their defenses accordingly. This strategic insight is crucial for staying one step ahead of attackers and fortifying cybersecurity defenses against the most common and impactful attack vectors.
Interpreting Advanced Metrics
Beyond the basic insights, understanding Percentiles for Time to Remediation, Count of Attack Paths by Remediation Time Brackets, and MTTR adds depth to your security analysis:
Percentiles for Time to Remediation
Time to Remediation (TTR) is a critical metric that measures the elapsed time of the creation of an attack path and its resolution. In the context of this Azure Workbook Attack Path Over Time Dashboard, Percentiles for Time to Remediation, specifically the 50th (median) and 90th percentiles, provide a detailed view of how quickly and efficiently an organization can mitigate threats.
50th Percentile (Median TTR): This metric represents the median response time, offering a snapshot of the typical remediation speed. A lower 50th percentile value is indicative of a swift median response time to threats, signifying that half of all detected attack paths are mitigated faster than the median value. This is an essential benchmark for security teams, reflecting their general responsiveness.
90th Percentile: The 90th percentile exposes concerns on the longer tail of remediation times, capturing how the most protracted responses are managed. A higher 90th percentile value may signal potential bottlenecks or complexities in resolving the most challenging incidents. This metric is crucial for identifying outliers in the remediation process, which, if addressed, could significantly improve overall security efficiency.
Count of Attack Paths by Remediation Time Brackets
To further refine the analysis, the dashboard segments the Count of Attack Paths into various Remediation Time Brackets (e.g., 0-7 days, 8-30 days, 31-60 days, over 60 days). This segmentation allows organizations to understand the distribution of their remediation efforts across different time frames.
High counts in shorter brackets (e.g., 0-7 days) suggest a robust capability to rapidly respond to a majority of threats, highlighting an effective incident response mechanism.
Conversely, significant counts in longer brackets (especially over 60 days) pinpoint areas where improvements are necessary. This could indicate more complex security issues requiring additional resources or more effective strategies to reduce the remediation time.
Mean Time to Remediation (MTTR)
Mean Time to Remediation (MTTR) aggregates the overall efficiency of the attack path resolution process into a single, comprehensive metric. It calculates the average time taken to resolve threats, offering a bird’s eye view of the organization’s response efficacy.
A lower MTTR value denotes quicker average remediation times, implying a highly efficient and agile response mechanism. This is the ideal scenario, as it minimizes the window of vulnerability, reducing the potential impact of breaches.
A higher MTTR, on the other hand, suggests room for improvement in the speed of remediation handling. It prompts security teams to delve deeper into the causes—be it the complexity of the attack paths exposed threats, resource constraints, or gaps in existing processes—and seek ways to enhance their response strategies.
Together, these advanced metrics serve as a compass for organizations, guiding them toward more effective and timely threat mitigation strategies. By analyzing Percentiles for Time to Remediation, the Count of Attack Paths by Remediation Time Brackets, and Mean Time to Remediation, security teams can gain insights into their operational strengths and areas in need of enhancement. This level of understanding is crucial for continuously refining cybersecurity defenses, ensuring organizations remain resilient in the face of an ever-evolving threat landscape.
Fictional Use Case: Woodgrove Bank’s Cybersecurity Overhaul
Woodgrove Bank, a fictitious, rapidly growing tech company, recently faced a surge in cybersecurity threats as it expanded its digital footprint. Recognizing the critical need to enhance its security posture, the company adopted Microsoft Defender for Cloud and enabled the Defender CSPM so they could leverage the integrated attack path analysis feature. Woodgrove Bank also decided to adopt the Azure Workbook Attack Path Over Time Dashboard to monitor and analyze attack paths over time.
The Challenge
With its expansion, Woodgrove Bank experienced an increase in sophisticated cyber threats targeting its infrastructure. Initial analyses revealed a lack of clarity in prioritizing threats and an inconsistent approach to threat remediation. The security team’s challenge was to streamline the process, ensuring rapid response to the most critical vulnerabilities.
Implementing the Azure Workbook Attack Path Over Time Dashboard
Upon implementing the Azure Workbook Attack Path Over Time Dashboard, Woodgrove Bank’s security team gained valuable insight into the company’s cybersecurity dynamics. The dashboard’s metrics highlighted various aspects of their security posture, from the distribution of attack paths to the efficiency of response mechanisms.
The Monthly Report
Based on the insights gleaned from the dashboard, Woodgrove Bank produced a monthly report encapsulating their findings and strategies for improvement:
Remediation Efficiency: The Mean Time to Remediation (MTTR) stood at 30 days. This metric, while reflective of a competent level of response, suggested room for improvement, particularly in handling complex attack vectors more efficiently.
Distribution of Resolution Times: Analysis revealed a distribution that highlighted both strengths and areas for improvement:
0-7 days: 100 attack paths were remediated, showcasing the team’s ability to quickly address a significant number of threats.
8-30 days: 75 attack paths, indicating a moderate response time for a substantial portion of threats.
31-60 days: 50 attack paths, pointing to complexities or resource allocation issues for a noteworthy fraction of incidents.
Over 60 days: 25 attack paths remained unresolved for extended periods, underscoring critical vulnerabilities in the existing response framework.
Classification of Overall Attack Path Remediation Efficiency: Considering the metrics, Woodgrove Bank classified its remediation efficiency as ‘Moderate.’ The rapid resolution of many threats demonstrated strong capabilities, but the slower response to a significant number of incidents highlighted the necessity for strategic enhancements.
Strategies for Improvement
Based on the insights from the monthly report, Woodgrove Bank outlined several key strategies to bolster its cybersecurity posture:
Prioritizing Rapid Response: Focusing on reducing the MTTR by streamlining response protocols and enhancing the agility of the security operations team.
Resource Reallocation: Shifting additional resources to address complex threats within the 31-60 day bracket more effectively.
Enhanced Training and Tools: Investing in advanced training for the security team and integrating cybersecurity tools to tackle attack vectors efficiently.
Continuous Monitoring and Adjustment: Leveraging the Azure Workbook Attack Path Over Time Dashboard for ongoing monitoring and fine-tuning of security strategies based on data and emerging threat landscapes.
Through the adoption of the Azure Workbook Attack Path Over Time Dashboard and the insights from the monthly report, Woodgrove Bank embarked on a strategic overhaul of its cybersecurity defenses. This use case illustrates the power of advanced analytics in transforming an organization’s approach to cybersecurity, enabling a proactive, data-driven strategy to safeguard digital assets against an ever-evolving array of threats.
Conclusion
The Azure Workbook Attack Path Over Time Dashboard represents a significant advancement in cybersecurity defense, providing deep insights into the dynamics of proactive attack paths insights. It equips security teams with the necessary knowledge and tools to enhance their security posture, enabling proactive and informed responses to a diverse array of threats. By leveraging this powerful dashboard, organizations can not only respond to threats more effectively but also elevate their security operations to new levels of efficiency and sophistication
Additional Resources
If you are using Attack Path and Cloud Security Explorer and want to share your feedback with the Defender for Cloud Team, please e-mail us directly from here. You can also use the resources below to learn more about these capabilities:
Cloud security explorer and Attack path analysis (Video)
Identify and remediate attack paths
Microsoft Defender for Cloud Security Posture Management
Reviewers
Yuri Diogenes, Principal PM Manager, CxE Defender for Cloud
Microsoft Tech Community – Latest Blogs –Read More

IAMCP Partnering as a Practice Masterclass: Building Dynamic Partnerships
Masterclass #2
Partnering can be your source of strategic advantage by providing the expertise and market coverage to reach new markets and win more clients – if it’s done right. Otherwise, it can be a huge drain on time and resources without yielding results.
Join us on April 25th to learn why partnerships fail and how to grow them from opportunistic and ad-hoc to repeatable and strategic. Our panel of experts will share partnering learnings and how to evolve high-performing partnerships.
Register here
Contact info@iamcp.org for more information and be sure to join our IAMCP discussion board on tech community!
Microsoft Tech Community – Latest Blogs –Read More
Viva Communications and Communities Guide to M365 Community Conference!
Join Microsoft and community experts in-person, in one place, at the Microsoft 365 Community Conference in Orlando, FL, April 30 – May 2, 2024. The event is dedicated to Microsoft Copilot and AI, Viva, Teams, SharePoint, OneDrive, Power Platform, and related Microsoft 365 apps and services, plus a full Transformation track for communicators, HR, and business stakeholders in workplace experience.
The role of communicators has changed rapidly over the last few years. Learn how Viva and AI is here to modernize comms and deliver a next generation employee experience through a mix of technology, strategy, and change management.
You’ll hear the latest product updates and guidance from over 175 Microsoft product makers — filled with real-world solutions across keynotes, sessions, and pre/post event deep-dive workshops to build your expertise – presented alongside Microsoft MVPs and community experts. We hope you join in to learn, share, and engage – including evening gatherings, the attendee party (hosted at Universal Islands of Adventure), and Microsoft will have a dedicated, fully-staffed product booth and community space within the Expo Hall alongside all the wonderful event sponsors.
Below are the details for the opening and closing keynotes with Jeff Teper and Karuana Gatimu, respectively, the AMA with Jeff Teper and other product leaders, and key sessions focused on the Viva Communications & Communities solution (all times listed in EDT). To see all that Microsoft is planning for the event, please review our Microsoft 365 Community Conference event guide.
OPENING KEYNOTE: The Age of Copilots with Jeff Teper (President of Collaboration Apps and Platforms) | Tuesday, April 30, 8:00am – 9:30am (Pacific Hall)
CLOSING KEYNOTE: Delivering Business Value and User Satisfaction in the Era of AI with Karuana Gatimu | Thursday, May 2, 2:45pm – 3:45pm
Microsoft AMA with Jeff Teper and numerous product leaders | Thursday, May 2, 1:30pm – 2:30pm
Building Engaging Employee Experiences for Viva Connections Using SPFx with Derek Cash-Peterson | Tuesday, April 30, 11:30am – 12:30pm (Dolphin: Northern Hemisphere A1)
Building State of the Art Viva Connections Cards No Matter the Platform You Are Starting From with Luca Bandinelli and Vesa Juvonen | Tuesday, April 30, 2:00pm – 3:00pm (Dolphin: Southern Hemisphere III)
Building the Future with Viva Connections with Nancy Handa and Tejas Mehta | Tuesday, April 30, 11:30am – 12:30pm (Dolphin: Northern Hemisphere E-3)
Driving Rollout and Enablement of Copilot with Microsoft Viva with Allison Michels, Britt Boston, Chris Bortlik, Jeffrey Manning, and Maeneka Grewal | Wednesday, May 1, 4:00pm – 5:00pm (Swan: Swan Ballroom 6A)
Employee Listening and Feedback with Viva Insights, Glint and Pulse with Jaime Gonzalez and Quentin Mackey | Thursday, May 2, 9:15am – 10:15am (Dolphin: Southern Hemisphere V)
Getting Started with Viva Amplify with Michael Holste and Naomi Moneypenny | Thursday, May 2, 11:00am-12:00pm (Swan: Osprey Ballroom)
How to Pitch and Build a Custom State of the Art Intranet and Viva Connections to Work Together with Ed Averett and Vesa Juvonen | Wednesday, May 1, 11:20am-12:20pm (Dolphin: Southern Hemisphere III)
Intranet Surgery: How Copilot and Viva Connections Can Give Your Intranet a Makeover with Susan Hanley | Wednesday, May 1, 8:00am-9:00am (Swan: Mockingbird 2)
Lightning Talk – Accelerate Viva Connections Time to Value with Nancy Handa and Tejas Mehta | Tuesday, April 30, 5:00pm-5:20pm (Expo Hall – Microsoft Lightning Talk Theater)
Lightning Talk – Embrace a skills-powered learning culture with Viva Learning with Michael Holste | Tuesday, April 30, 4:00pm-4:20pm (Expo Hall – Microsoft Lightning Talk Theater)
Lightning Talk – Leveraging Copilot and AI for Communications in Viva Engage with Allison Michels and Kristi Kelly | Wednesday, May 1, 3:00pm-3:20pm (Expo Hall – Microsoft Lightning Talk Theater)
Planning a Corporate Communications Strategy with SharePoint News and Viva Amplify with Dave Cohen, Maeneka Grewal, and Naomi Moneypenny | Wednesday, May 1, 8:00am-9:00am (Dolphin: Northern Hemisphere D E Corridor)
The Viva Communications and Communities Solution with Ed Averett, Jason Mayans, and Naomi Moneypenny | Thursday, May 2, 8:00am-9:00am (Dolphin: Northern Hemisphere D E Corridor)
Unleashing Viva Amplify’s Potential for Maximum ROI with Corey Roth | Wednesday, May 1, 4:00pm-5:00pm (Dolphin: Southern Hemisphere I)
Viva Communications & Communities Administration, Moderation, Security and Compliance with Maeneka Grewal, Mike McLean, and Nancy Handa | Wednesday, May 1, 11:20am-12:20pm (Dolphin: Northern Hemisphere C)
Viva Engage and AI Transform Communications: From Eyeballs to Engagement, Channels to Change Agent with Dan Holme and Jayson Mayans | Tuesday, April 30, 2:00pm-3:00pm (Dolphin: Northern Hemisphere D E Corridor)
Join the Microsoft 365 Community Conference in Orlando, FL, April 30 – May 2, 2024 (sponsored by Microsoft).
To give you a deeper view into what we have planned, review event insights from our product teams:
Learn more about the Communications & Communities solution
Read the latest Viva news and updates on our blog
Follow the action with live sessions on Twitter @M365Conf
Learn more about Microsoft Viva
Use the MSCMTY discount code to save $100 USD (limited time only).
Hope to see you there!
Microsoft Tech Community – Latest Blogs –Read More

REGISTRATION NOW OPEN: Azure Nonprofit Open Office Hours | April – June
Learn how to harness the power of Azure to drive impact and transform operations. Dive into hot topics with Sergio Victorio Queija and Narindi Chhan.
Reserve your spot for these upcoming sessions!
April 30, 2024
8:00am – 9:00am PST | Register Here
4:00pm – 5:00pm PST | Register Here
May 29, 2024
8:00am – 9:00am PST | Register Here
4:00pm – 5:00pm PST | Register Here
June 20, 2024
8:00am – 9:00am PST | Register Here
4:00pm – 5:00pm PST | Register Here
Read More
Is it possible to use images from Copilot for commercial purposes?
Is it possible to use images from Copilot for commercial purposes?
Is it possible to use images from Copilot for commercial purposes? Read More

Aligning text in Word in a numbered list
Hello! I have a problem! Can you please help ASAP?
I have a numbered list. It’s elements consists of several rows. When it is required to go to the next row, the text is aligned under the number and doesn’t aligned from the start of the page.
Here are a screenshots:
This is how it looks like:
And how I want it to look like(the text is not aligned under the number):
When you simply hits backspace, it simply put on the line before. When you press enter it creates new line that is not connected to the numbered list
Hello! I have a problem! Can you please help ASAP?I have a numbered list. It’s elements consists of several rows. When it is required to go to the next row, the text is aligned under the number and doesn’t aligned from the start of the page. Here are a screenshots: This is how it looks like:And how I want it to look like(the text is not aligned under the number):When you simply hits backspace, it simply put on the line before. When you press enter it creates new line that is not connected to the numbered list Read More
vlookup
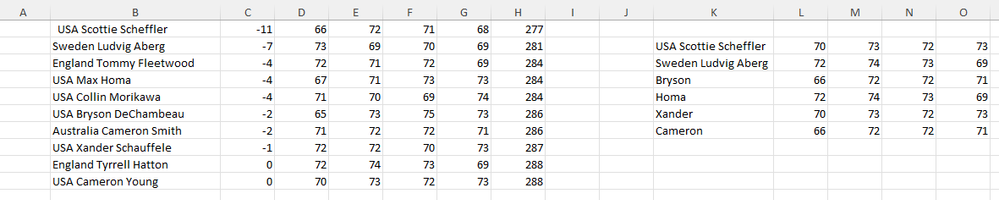
I downloaded some results from the Masters Golf Tournament and would like to use vlookup to populate a spreadsheet with only select golfers. I’ve reduced the leaderboard to save space.
The formula in cell L2 is =VLOOKUP($K2,$B$1:$H$10,3,TRUE), formula in cell M2 is =VLOOKUP($K2,$B$1:$H$10,4,TRUE), etc.
The result for the formula in cell L2 should lookup K2 (Scottie), find him in the range $B$1 and return column 3 which is 66. The results are coming from the last row for Cameron Young.
I can’t figure what I am doing wrong.
I downloaded some results from the Masters Golf Tournament and would like to use vlookup to populate a spreadsheet with only select golfers. I’ve reduced the leaderboard to save space.The formula in cell L2 is =VLOOKUP($K2,$B$1:$H$10,3,TRUE), formula in cell M2 is =VLOOKUP($K2,$B$1:$H$10,4,TRUE), etc. The result for the formula in cell L2 should lookup K2 (Scottie), find him in the range $B$1 and return column 3 which is 66. The results are coming from the last row for Cameron Young. I can’t figure what I am doing wrong. Read More
Question about the excel spreadsheet row limit
Hi,
I’m having trouble understanding what is meant by the excel worksheet/workbook row limit of
Hi, I’m having trouble understanding what is meant by the excel worksheet/workbook row limit of 1,048,576 rows. Does this mean that Excel cannot display a greater number of rows or that it cannot store data for more than than 1,048,576 rows? For example, if I combine various datasets and write this combined dataset to an excel spreadsheet file, and this dataset contains 2 million rows and 20 columns, will the excel spreadsheet contain all 2 million rows and the data contained in each of them? Not being able to view all 2 million rows in Excel is not an issue; I just want to be sure that no data is being lost. Thank you! Read More
Advanced Hunting – Unable to search ‘EmailEvents’
Hello,
I have a customer that is getting the error below and would like some insight on it?
Issue:
When using the Advanced Hunting, the object ‘EmailEvents’ returns:
“Syntax error
Error message
The incomplete fragment is unexpected”
Hello,
I have a customer that is getting the error below and would like some insight on it?
Issue:
When using the Advanced Hunting, the object ‘EmailEvents’ returns:”Syntax errorError messageThe incomplete fragment is unexpected” Read More
Exploring solutions for advanced management of presence and status in Microsoft Teams
Hello,
our company heavily utilizes Microsoft Teams for both internal and external communication, but we are facing specific challenges that we’re looking to overcome. We are particularly interested in exploring innovative solutions like Mesh for Microsoft Teams as well as other potential add-ons or custom policies that might enhance our management of employee presence and status. Here’s a summary of our needs:
1. Monitoring Actual Presence of Employees: we struggle to accurately determine the physical presence of our collaborators during the workday. We’re interested in finding out if there are any policies or add-ons that can integrate with Teams to provide more precise indications of presence.
2. Detecting the Actual Status of Employees: we often find that the automatic presence status in Teams does not accurately reflect an employee’s real availability. We would be interested in discovering tools that improve this functionality, perhaps through more sophisticated integrations that consider real calendar commitments.
3. Improving Cooperation and Work Group Organization: we are looking for solutions that can facilitate better organization of common activities and enhance the effectiveness of communication.
4. Recreating Typical In-Person Work Situations: with the increase in remote work, we want to implement tools that help recreate the spontaneity of face-to-face encounters, such as virtual coffee breaks or spaces for casual meetings.
We are open to exploring Mesh for Microsoft Teams but also other solutions that might include specific add-ons or policy configurations that enhance these functionalities. Does anyone have experiences or advice to share on how to optimize the use of Teams in these areas?
Thank you very much for any help or suggestions you can offer!
Hello,our company heavily utilizes Microsoft Teams for both internal and external communication, but we are facing specific challenges that we’re looking to overcome. We are particularly interested in exploring innovative solutions like Mesh for Microsoft Teams as well as other potential add-ons or custom policies that might enhance our management of employee presence and status. Here’s a summary of our needs:1. Monitoring Actual Presence of Employees: we struggle to accurately determine the physical presence of our collaborators during the workday. We’re interested in finding out if there are any policies or add-ons that can integrate with Teams to provide more precise indications of presence.2. Detecting the Actual Status of Employees: we often find that the automatic presence status in Teams does not accurately reflect an employee’s real availability. We would be interested in discovering tools that improve this functionality, perhaps through more sophisticated integrations that consider real calendar commitments.3. Improving Cooperation and Work Group Organization: we are looking for solutions that can facilitate better organization of common activities and enhance the effectiveness of communication.4. Recreating Typical In-Person Work Situations: with the increase in remote work, we want to implement tools that help recreate the spontaneity of face-to-face encounters, such as virtual coffee breaks or spaces for casual meetings.We are open to exploring Mesh for Microsoft Teams but also other solutions that might include specific add-ons or policy configurations that enhance these functionalities. Does anyone have experiences or advice to share on how to optimize the use of Teams in these areas?Thank you very much for any help or suggestions you can offer! Read More


